OPEN-SOURCE SCRIPT
HDBhagat multi time frame box analysis
Title: Multi-Timeframe Box Analysis Indicator
Description:
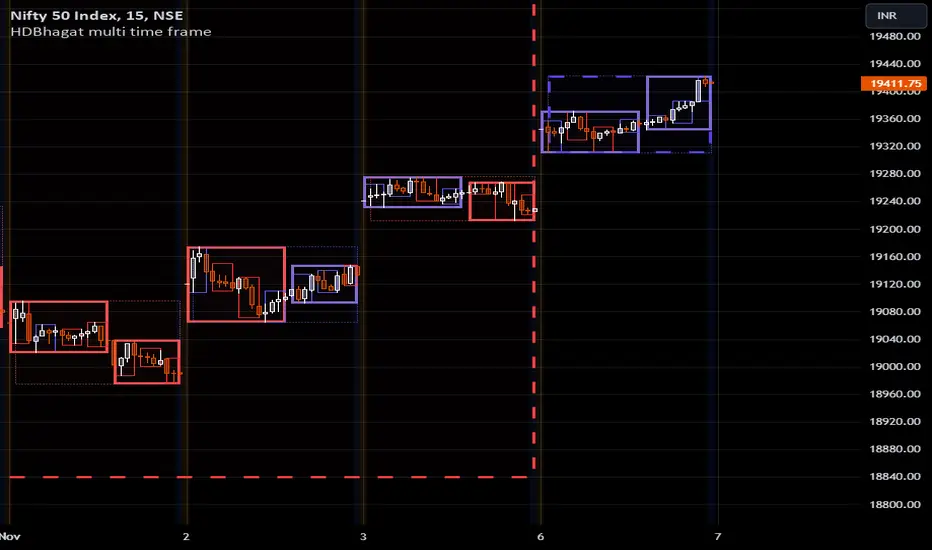
The Multi-Timeframe Box Analysis Indicator is a powerful tool designed for use on the TradingView platform. It provides a visual representation of price movements across multiple timeframes, allowing traders to gain insights into potential trend changes and key support/resistance levels.
Key Features:
Multi-Timeframe Analysis: The indicator analyzes price data across different timeframes (1W, 1D, 4H, and 1H) simultaneously, providing a comprehensive view of market trends.
Box Visualization: The indicator represents price movements within each timeframe as colored boxes. Green boxes indicate bullish price action, while red boxes represent bearish movements.
Customizable Settings: Traders can easily adjust the input parameters to suit their specific trading preferences, including timeframe selection and box appearance settings.
Historical and Real-Time Updates: The indicator updates in real-time, ensuring that traders have access to the latest information. It also accounts for historical data to provide context for past price movements.
How to Use:
Apply the Multi-Timeframe Box Analysis Indicator to your TradingView chart.
Customize the indicator settings according to your preferred timeframes and visual preferences.
Observe the boxes on the chart to identify trends, potential reversals, and key support/resistance levels.
Use the information provided by the indicator to make informed trading decisions.
Disclaimer:
This indicator is a visual representation of historical and real-time price movements and is intended for informational purposes only. It does not guarantee future performance or trading success. Traders should conduct their own analysis and consider additional factors before making any trading decisions.
Note: Past performance is not indicative of future results. Always use proper risk management and consider consulting a financial advisor before making any trading decisions.
오픈 소스 스크립트
트레이딩뷰의 진정한 정신에 따라, 이 스크립트의 작성자는 이를 오픈소스로 공개하여 트레이더들이 기능을 검토하고 검증할 수 있도록 했습니다. 작성자에게 찬사를 보냅니다! 이 코드는 무료로 사용할 수 있지만, 코드를 재게시하는 경우 하우스 룰이 적용된다는 점을 기억하세요.
면책사항
해당 정보와 게시물은 금융, 투자, 트레이딩 또는 기타 유형의 조언이나 권장 사항으로 간주되지 않으며, 트레이딩뷰에서 제공하거나 보증하는 것이 아닙니다. 자세한 내용은 이용 약관을 참조하세요.
오픈 소스 스크립트
트레이딩뷰의 진정한 정신에 따라, 이 스크립트의 작성자는 이를 오픈소스로 공개하여 트레이더들이 기능을 검토하고 검증할 수 있도록 했습니다. 작성자에게 찬사를 보냅니다! 이 코드는 무료로 사용할 수 있지만, 코드를 재게시하는 경우 하우스 룰이 적용된다는 점을 기억하세요.
면책사항
해당 정보와 게시물은 금융, 투자, 트레이딩 또는 기타 유형의 조언이나 권장 사항으로 간주되지 않으며, 트레이딩뷰에서 제공하거나 보증하는 것이 아닙니다. 자세한 내용은 이용 약관을 참조하세요.