OPEN-SOURCE SCRIPT
Pappabborgia Nasdaq RSI
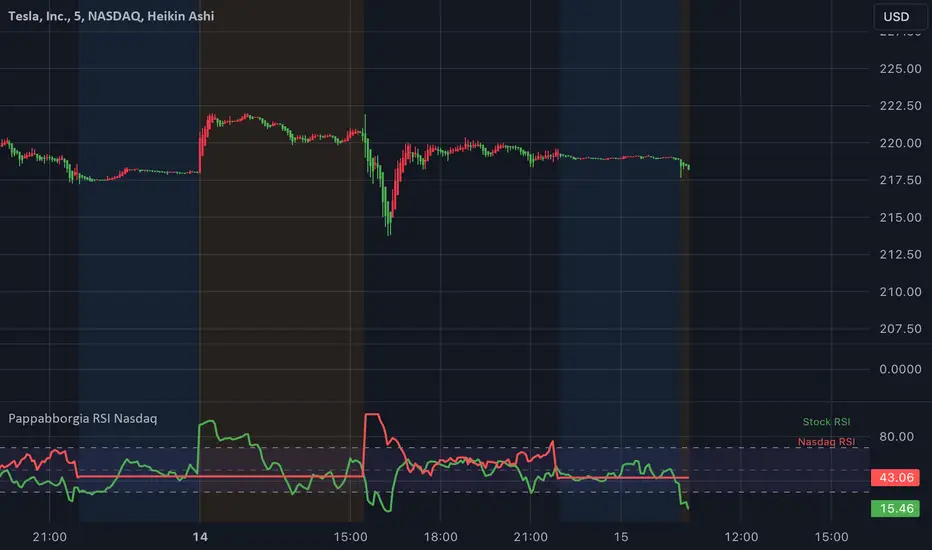
This script provides a custom Relative Strength Index (RSI) indicator that plots both the RSI of the selected stock and the Nasdaq (IXIC) on the same chart.
It offers a clear, side-by-side view to help traders better understand the stock's momentum relative to the overall market.
Key Features:
RSI Calculation for the Stock:
The script calculates the RSI for the chosen stock, with a default period of 14, adjustable to fit different timeframes.
The stock’s RSI is displayed in green 🟢, providing a direct view of its strength and momentum 📈.
RSI of the Nasdaq:
The script fetches the Nasdaq’s closing prices and calculates its RSI, which is shown in red for clear comparison 🔴.
Legend for Clarity:
A simple legend in the top-right corner identifies the green line as the stock’s RSI and the red line as the Nasdaq’s RSI, making it easy to interpret 📊.
Why Comparing the Stock's RSI to the Nasdaq Matters:
Broader Market Context:
Viewing both RSIs on the same chart helps you see whether the stock is moving in sync with the broader market or behaving independently. This provides valuable context for decision-making 📉.
Relative Strength Insights:
Comparing the stock’s RSI to the Nasdaq’s RSI highlights whether the stock is outperforming or underperforming the overall market, helping identify potential opportunities or risks 🟢🔴.
Improved Risk Management:
Monitoring overbought or oversold conditions in both the stock and Nasdaq RSIs can signal broader market trends and help avoid risky trades ⚠️.
Overall Benefit:
By tracking the RSI of both the stock and the Nasdaq, this script offers a powerful tool for understanding a stock's relative strength, providing essential context for smarter trading decisions 🎯.
오픈 소스 스크립트
트레이딩뷰의 진정한 정신에 따라, 이 스크립트의 작성자는 이를 오픈소스로 공개하여 트레이더들이 기능을 검토하고 검증할 수 있도록 했습니다. 작성자에게 찬사를 보냅니다! 이 코드는 무료로 사용할 수 있지만, 코드를 재게시하는 경우 하우스 룰이 적용된다는 점을 기억하세요.
면책사항
해당 정보와 게시물은 금융, 투자, 트레이딩 또는 기타 유형의 조언이나 권장 사항으로 간주되지 않으며, 트레이딩뷰에서 제공하거나 보증하는 것이 아닙니다. 자세한 내용은 이용 약관을 참조하세요.
오픈 소스 스크립트
트레이딩뷰의 진정한 정신에 따라, 이 스크립트의 작성자는 이를 오픈소스로 공개하여 트레이더들이 기능을 검토하고 검증할 수 있도록 했습니다. 작성자에게 찬사를 보냅니다! 이 코드는 무료로 사용할 수 있지만, 코드를 재게시하는 경우 하우스 룰이 적용된다는 점을 기억하세요.
면책사항
해당 정보와 게시물은 금융, 투자, 트레이딩 또는 기타 유형의 조언이나 권장 사항으로 간주되지 않으며, 트레이딩뷰에서 제공하거나 보증하는 것이 아닙니다. 자세한 내용은 이용 약관을 참조하세요.