OPEN-SOURCE SCRIPT
업데이트됨 Price - Mean Reversion Expansion
A simple indicator, to plot the quantitatively the reversion and expansion of price from a set of means.
A green bar plots prices above the set of means. A bar plots prices below the set of means. A blue bar plots price entangled in the means. The height of the bars denotes the far-ness from the set of means.
A blue envelope over the bars is the average of this reversion/expansion. A "crossover" of any bar (red/green) over this envelope is indicated by a "green dot" a "crossunder" of any bar (red/green) under this envelope is indicated by a "red dot".
The small trend strength table (when enabled) on the right side below show in a easy manner the data presented in the "Mean Angles" indicator. Refer to description there for more details.
릴리즈 노트
- Added Price Delta, scaled price performance
Added an overlap of scaled price movement vis-a-vis the expansion and contraction. Clearly identifies the trend changes and objectively defines expansion and reversion.
릴리즈 노트
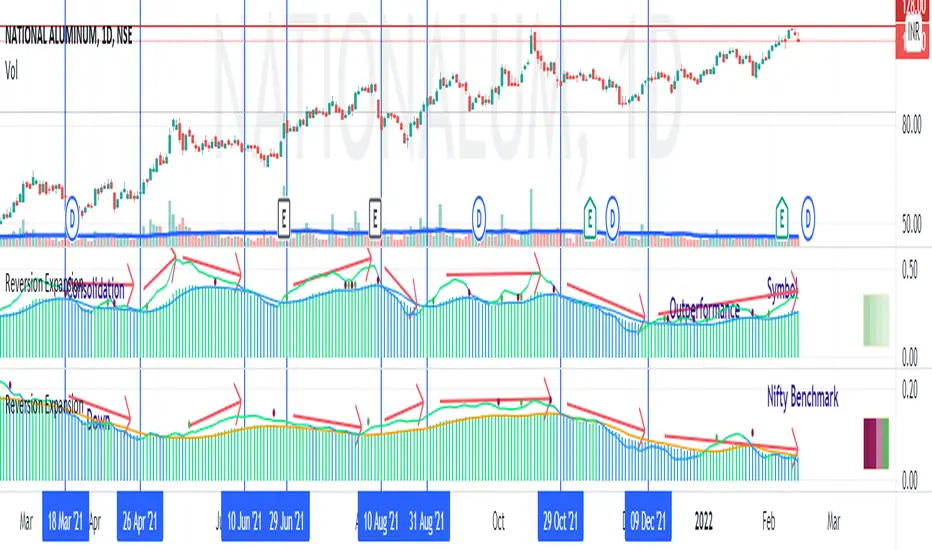
- Option to select another symbol (benchmark) instead of the chart symbol
This option will help in measuring the reversion / expansion vis-a-vis broader benchmark when placed side-by-side. When the other symbol (benchmark is ticked, the envelope will be of orange color and not the usual blue color. This will help in quick identification.
Refer to
The lower plot is orange envelope, that of the benchmark. We can clearly observe regions where the symbol followed the benchmark, outperforms or lags the benchmark. This analysis can be done over multiple timeframes.
릴리즈 노트
- Fixed other symbol EMA calculations when valid mean length of symbol starts later than benchmark
릴리즈 노트
- Update Pine Script version 6
- Alert conditions and TrendLength additions - for Pine Screener
오픈 소스 스크립트
트레이딩뷰의 진정한 정신에 따라, 이 스크립트의 작성자는 이를 오픈소스로 공개하여 트레이더들이 기능을 검토하고 검증할 수 있도록 했습니다. 작성자에게 찬사를 보냅니다! 이 코드는 무료로 사용할 수 있지만, 코드를 재게시하는 경우 하우스 룰이 적용된다는 점을 기억하세요.
면책사항
해당 정보와 게시물은 금융, 투자, 트레이딩 또는 기타 유형의 조언이나 권장 사항으로 간주되지 않으며, 트레이딩뷰에서 제공하거나 보증하는 것이 아닙니다. 자세한 내용은 이용 약관을 참조하세요.
오픈 소스 스크립트
트레이딩뷰의 진정한 정신에 따라, 이 스크립트의 작성자는 이를 오픈소스로 공개하여 트레이더들이 기능을 검토하고 검증할 수 있도록 했습니다. 작성자에게 찬사를 보냅니다! 이 코드는 무료로 사용할 수 있지만, 코드를 재게시하는 경우 하우스 룰이 적용된다는 점을 기억하세요.
면책사항
해당 정보와 게시물은 금융, 투자, 트레이딩 또는 기타 유형의 조언이나 권장 사항으로 간주되지 않으며, 트레이딩뷰에서 제공하거나 보증하는 것이 아닙니다. 자세한 내용은 이용 약관을 참조하세요.