OPEN-SOURCE SCRIPT
Multi Timeframe MAs
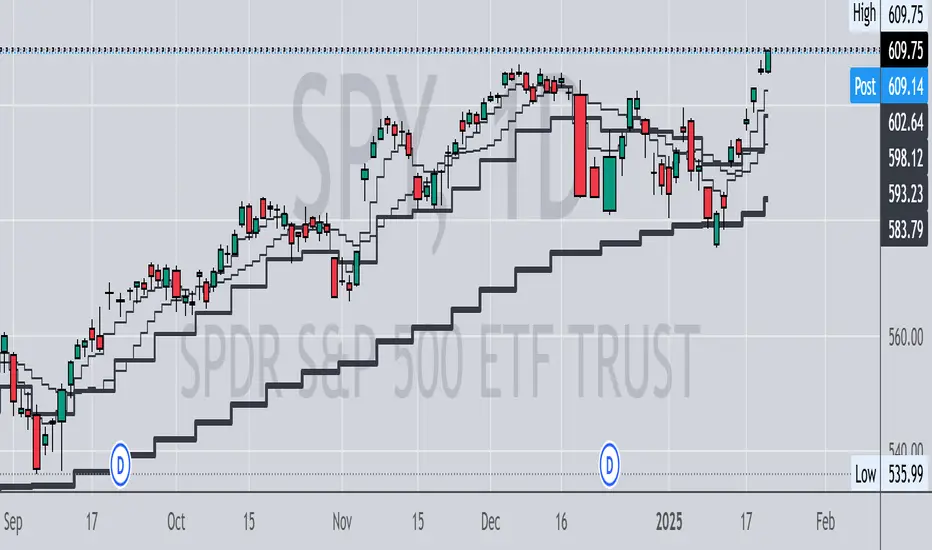
This Pine Script indicator, titled "Multi Timeframe MAs," allows you to plot Exponential Moving Averages (EMAs) or Simple Moving Averages (SMAs) from multiple timeframes on a single chart. This helps traders and analysts visualize and compare different moving averages across various timeframes without having to switch between charts.
Key Features:
Multiple Timeframes:
The script supports six different timeframes, ranging from minutes to weekly intervals.
Users can input their desired timeframes, including custom settings such as "60" (60 minutes), "D" (daily), and "W" (weekly).
Moving Average Types:
Users can choose between Exponential Moving Averages (EMA) and Simple Moving Averages (SMA) for each timeframe.
The script utilizes a ternary operator to determine whether to calculate an EMA or an SMA based on user input.
Customizable Periods:
Each moving average can have a different period, allowing for flexibility in analysis.
The default periods are set to commonly used values (e.g., 15, 20, 5, 12).
Visibility Controls:
Users can toggle the visibility of each moving average line, enabling or disabling them as needed.
This feature helps declutter the chart when specific moving averages are not required.
Black Stepped Lines:
All moving averages are plotted as black, stepped lines to provide a clear and consistent visual representation.
This makes it easy to distinguish these lines from other elements on the chart.
Example Use Cases:
Trend Analysis: Compare short-term and long-term trends by visualizing moving averages from different timeframes on a single chart.
Support and Resistance Levels: Identify key support and resistance levels across multiple timeframes.
Cross-Timeframe Strategy: Develop and test trading strategies that rely on the confluence of moving averages from different timeframes.
This script offers a powerful tool for traders and analysts who want to gain deeper insights into market movements by examining moving averages across multiple timeframes. With its customizable settings and user-friendly interface, it provides a versatile solution for a wide range of trading and analytical needs.
오픈 소스 스크립트
트레이딩뷰의 진정한 정신에 따라, 이 스크립트의 작성자는 이를 오픈소스로 공개하여 트레이더들이 기능을 검토하고 검증할 수 있도록 했습니다. 작성자에게 찬사를 보냅니다! 이 코드는 무료로 사용할 수 있지만, 코드를 재게시하는 경우 하우스 룰이 적용된다는 점을 기억하세요.
면책사항
해당 정보와 게시물은 금융, 투자, 트레이딩 또는 기타 유형의 조언이나 권장 사항으로 간주되지 않으며, 트레이딩뷰에서 제공하거나 보증하는 것이 아닙니다. 자세한 내용은 이용 약관을 참조하세요.
오픈 소스 스크립트
트레이딩뷰의 진정한 정신에 따라, 이 스크립트의 작성자는 이를 오픈소스로 공개하여 트레이더들이 기능을 검토하고 검증할 수 있도록 했습니다. 작성자에게 찬사를 보냅니다! 이 코드는 무료로 사용할 수 있지만, 코드를 재게시하는 경우 하우스 룰이 적용된다는 점을 기억하세요.
면책사항
해당 정보와 게시물은 금융, 투자, 트레이딩 또는 기타 유형의 조언이나 권장 사항으로 간주되지 않으며, 트레이딩뷰에서 제공하거나 보증하는 것이 아닙니다. 자세한 내용은 이용 약관을 참조하세요.