PROTECTED SOURCE SCRIPT
업데이트됨 Ichimoku signals by Jean-Philippe COQ
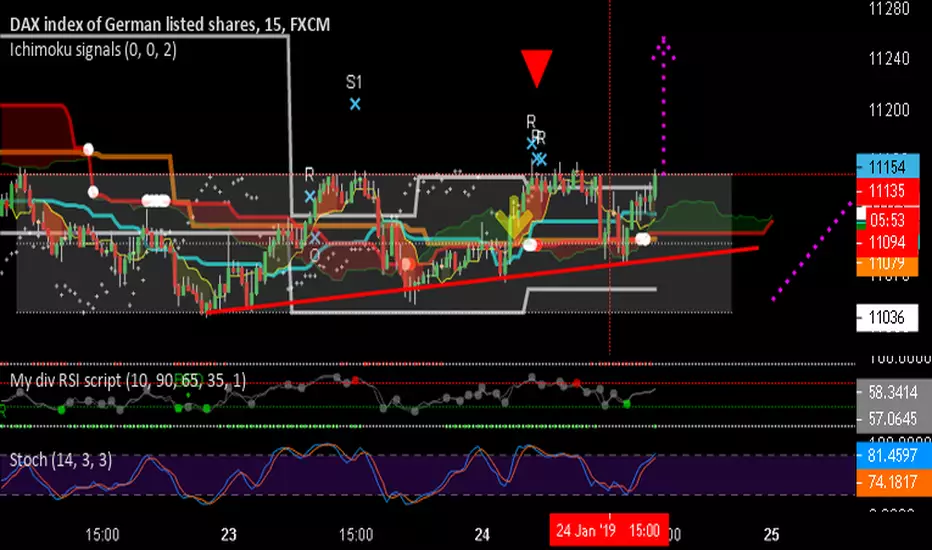
INDICATORS:
Show Yellow zone when oversold/overbought
Show splits : white when to come, yellow when occurs, red when flat with ssb, blue when flat with ssb and kj
Show probable range when appears in white lines
Show last higher highs lower lows in orange lines
Show probable next Kj values in thin aqua lines
checkChikou = blue diamond on price when close to chikou in TF or upper one
checkVol = show "V" when volume is higher than last 9 periods avg
checkRot = show "Z" when potential partial rotation in range is at work
checkHaram = take Harami pattern into account
SIGNALS (when ichimoku meet candle patterns)
L/H = rebound signals on higher highs / Lower Lows
C = potential rebound on overbought oversold zone
R = rebound signal on range edges
P = pullback rebound after break out of probable range
K = rebound on Kj in a trend (out of range)
릴리즈 노트
INDICATORS:Show Yellow zone between price and tenkan when oversold/overbought
Show splits : white when to come, yellow when occurs, red when occurs with a flat Senkou Span B, blue when occurs with a flat Senkou Span B and kijun
Show probable range in white lines
Show last higher highs & lower lows in orange lines
SIGNALS (when ichimoku meet candle patterns)
L/H = rebound signals on higher highs / Lower Lows, target can be lower kj flat
C = potential rebound on overbought oversold zone, target can be lower kj flat
R = rebound signal on range edges, target can be last split
B = pullback/throwback rebound after break out of probable range, target can be last higher high (lower low)
K = rebound on Kj in a trend (out of range), target can be last higher high (lower low)
OTHER PARAMETERS
checkHaram = take Harami pattern into account
CheckallCandle = include all candle patterns
checkVol = show "V" when volume is higher than last 9 periods average
showFuture = next kijun/ssa/ssb values in thin lines
closeToChikou = the greater the value close to ichimoku lines is the test
showChikou = red cross on price when close to chikou in TF or upper one
Flatlen = bars of same value to validate an ichimoku flat
CheckSignal1 = check and show upper TF signals => manual check because not perfect, to unset when study error message !!
ShowEntry = green buy signal (red sell) when buy signal and chikou free and ratio >=2
릴리즈 노트
workaround : remove signal UT1 to fix loop study issues릴리즈 노트
add partial rotation signalfix some bugs...
릴리즈 노트
signal greater range signals with highest on longer period릴리즈 노트
fix릴리즈 노트
fix ichimoku levels to see more릴리즈 노트
remove unrelevant signals릴리즈 노트
fix some bugs릴리즈 노트
minor bug fix and speed릴리즈 노트
show targets when available릴리즈 노트
fix some target bug릴리즈 노트
improve range edges릴리즈 노트
Remove some consuming loops릴리즈 노트
fix levels릴리즈 노트
add alert line릴리즈 노트
Take into account possible range within possible range보호된 스크립트입니다
이 스크립트는 비공개 소스로 게시됩니다. 하지만 이를 자유롭게 제한 없이 사용할 수 있습니다 – 자세한 내용은 여기에서 확인하세요.
면책사항
해당 정보와 게시물은 금융, 투자, 트레이딩 또는 기타 유형의 조언이나 권장 사항으로 간주되지 않으며, 트레이딩뷰에서 제공하거나 보증하는 것이 아닙니다. 자세한 내용은 이용 약관을 참조하세요.
면책사항
해당 정보와 게시물은 금융, 투자, 트레이딩 또는 기타 유형의 조언이나 권장 사항으로 간주되지 않으며, 트레이딩뷰에서 제공하거나 보증하는 것이 아닙니다. 자세한 내용은 이용 약관을 참조하세요.