OPEN-SOURCE SCRIPT
업데이트됨 Open Price Regression Model
nput Variables: The user can adjust the lookbackPeriod and m (multiplier) inputs. The lookbackPeriod specifies the number of previous bars used for regression calculations, and m is used to calculate the confidence interval width.
Calculate Regression Model: The code extracts open, high, low, and close prices for the current candle. It then performs regression calculations for high, low, and close prices based on the open prices.
Calculate Predicted Prices: Using the regression coefficients and intercepts, the code calculates predicted high, low, and close prices based on the current open price.
Calculate Confidence Interval: The code computes the standard errors of the regression for high, low, and close prices and multiplies them by the specified confidence level multiplier (m) to determine the width of the confidence intervals.
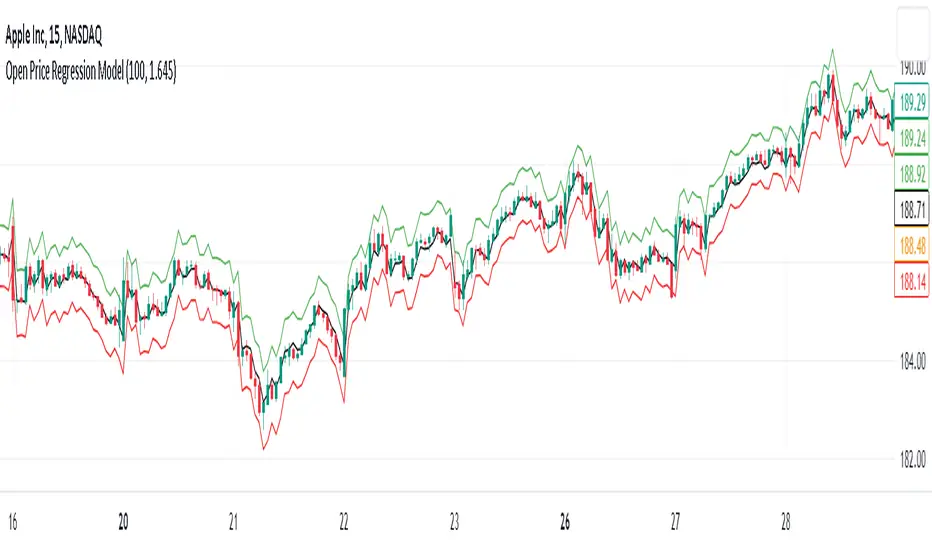
Plotting: The predicted high, low, and close prices are plotted with different colors. Additionally, confidence intervals are plotted around the predicted prices using lines.
Implications and Trading Advantage:
The Open Price Regression Model aims to predict future high, low, and close prices based on the current open price. Traders can use the predicted values and confidence intervals as potential price targets and volatility measures. Traders can consider taking long or short positions based on whether the current open price is below or above the predicted prices. Can be used on a daily time frame to forecast the day's high and low and use this levels are horizontal price levels on lower timeframes.
Calculate Regression Model: The code extracts open, high, low, and close prices for the current candle. It then performs regression calculations for high, low, and close prices based on the open prices.
Calculate Predicted Prices: Using the regression coefficients and intercepts, the code calculates predicted high, low, and close prices based on the current open price.
Calculate Confidence Interval: The code computes the standard errors of the regression for high, low, and close prices and multiplies them by the specified confidence level multiplier (m) to determine the width of the confidence intervals.
Plotting: The predicted high, low, and close prices are plotted with different colors. Additionally, confidence intervals are plotted around the predicted prices using lines.
Implications and Trading Advantage:
The Open Price Regression Model aims to predict future high, low, and close prices based on the current open price. Traders can use the predicted values and confidence intervals as potential price targets and volatility measures. Traders can consider taking long or short positions based on whether the current open price is below or above the predicted prices. Can be used on a daily time frame to forecast the day's high and low and use this levels are horizontal price levels on lower timeframes.
릴리즈 노트
Used on line chart for displaying actual price (blue line) instead on candles. The 1.282 multiplier is for 80% confidence interval (narrow band), 1.645 for 90% confidence interval and 1.960 for 95% confidence interval and 2.170 for 97% confidence interval (wider band) https://www.tradingview.com/chart/n4nTsEOA/릴리즈 노트
minor change 릴리즈 노트
core changes to the code how it performs the regression 릴리즈 노트
updated code and simplified 오픈 소스 스크립트
트레이딩뷰의 진정한 정신에 따라, 이 스크립트의 작성자는 이를 오픈소스로 공개하여 트레이더들이 기능을 검토하고 검증할 수 있도록 했습니다. 작성자에게 찬사를 보냅니다! 이 코드는 무료로 사용할 수 있지만, 코드를 재게시하는 경우 하우스 룰이 적용된다는 점을 기억하세요.
면책사항
해당 정보와 게시물은 금융, 투자, 트레이딩 또는 기타 유형의 조언이나 권장 사항으로 간주되지 않으며, 트레이딩뷰에서 제공하거나 보증하는 것이 아닙니다. 자세한 내용은 이용 약관을 참조하세요.
오픈 소스 스크립트
트레이딩뷰의 진정한 정신에 따라, 이 스크립트의 작성자는 이를 오픈소스로 공개하여 트레이더들이 기능을 검토하고 검증할 수 있도록 했습니다. 작성자에게 찬사를 보냅니다! 이 코드는 무료로 사용할 수 있지만, 코드를 재게시하는 경우 하우스 룰이 적용된다는 점을 기억하세요.
면책사항
해당 정보와 게시물은 금융, 투자, 트레이딩 또는 기타 유형의 조언이나 권장 사항으로 간주되지 않으며, 트레이딩뷰에서 제공하거나 보증하는 것이 아닙니다. 자세한 내용은 이용 약관을 참조하세요.