OPEN-SOURCE SCRIPT
DB LinReg Price Channel

DB LinReg Price Channel
What does the indicator do?
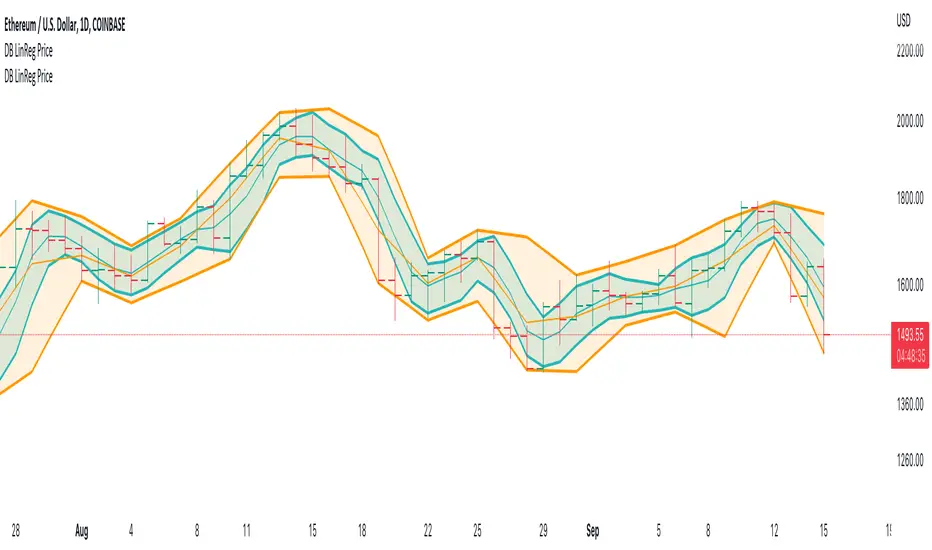
This indicator is very simple and designed to plot a quick linear regression channel for high, hlc3, and low. It allows the symbol and timeframe to be configured in the settings.
The purpose of the indicator is to obtain a price channel for the desired timeframe with outliers removed.
How should this indicator be used?
I personally use two of the indicators with one set to the current timeframe and the second set to 2x of the current timeframe. For example, 12H and Daily which gives you a fast and slow price channel for your desired timeframe. Price channels can help you know the value of the current price in respect to the timeframe and for pricing stop losses and liquidation levels.
Does the indicator include any alerts?
Not yet.
Use at your own risk and do your own diligence.
Enjoy!
오픈 소스 스크립트
트레이딩뷰의 진정한 정신에 따라, 이 스크립트의 작성자는 이를 오픈소스로 공개하여 트레이더들이 기능을 검토하고 검증할 수 있도록 했습니다. 작성자에게 찬사를 보냅니다! 이 코드는 무료로 사용할 수 있지만, 코드를 재게시하는 경우 하우스 룰이 적용된다는 점을 기억하세요.
면책사항
해당 정보와 게시물은 금융, 투자, 트레이딩 또는 기타 유형의 조언이나 권장 사항으로 간주되지 않으며, 트레이딩뷰에서 제공하거나 보증하는 것이 아닙니다. 자세한 내용은 이용 약관을 참조하세요.
오픈 소스 스크립트
트레이딩뷰의 진정한 정신에 따라, 이 스크립트의 작성자는 이를 오픈소스로 공개하여 트레이더들이 기능을 검토하고 검증할 수 있도록 했습니다. 작성자에게 찬사를 보냅니다! 이 코드는 무료로 사용할 수 있지만, 코드를 재게시하는 경우 하우스 룰이 적용된다는 점을 기억하세요.
면책사항
해당 정보와 게시물은 금융, 투자, 트레이딩 또는 기타 유형의 조언이나 권장 사항으로 간주되지 않으며, 트레이딩뷰에서 제공하거나 보증하는 것이 아닙니다. 자세한 내용은 이용 약관을 참조하세요.