OPEN-SOURCE SCRIPT
업데이트됨 Fear & Greed Index-Buschi
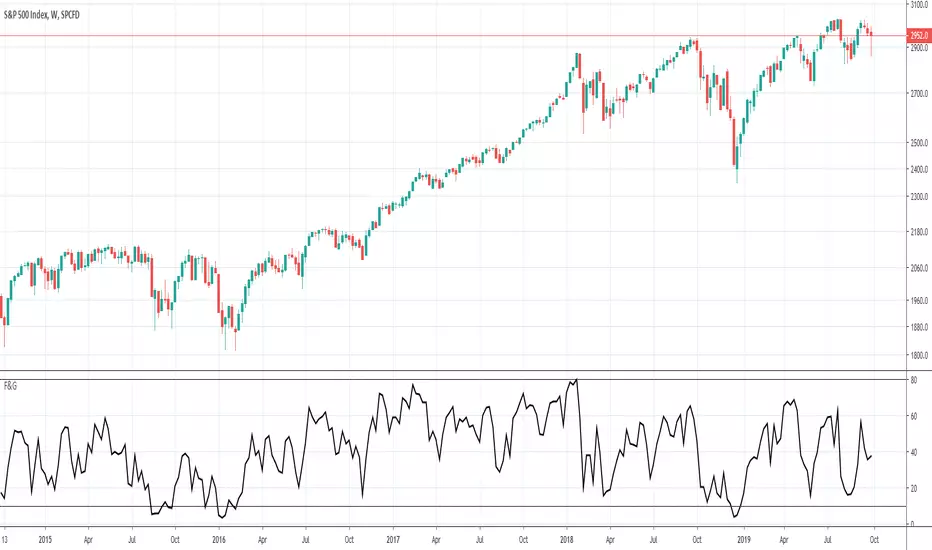
This is an attempt to mimic the CNN Money "Fear & Greed Index": money.cnn.com/data/fear-and-greed/
It's far from perfect, because the exact numbers can be a bit far off. Still, the highs and lows are quite on target. Alas, CNN does not give away too much information on how the index is calculated.
Feedback is most welcome.
It's far from perfect, because the exact numbers can be a bit far off. Still, the highs and lows are quite on target. Alas, CNN does not give away too much information on how the index is calculated.
Feedback is most welcome.
릴리즈 노트
This is an attempt to mimic the CNN Money Fear & Greed Index: money.cnn.com/data/fear-and-greed/It is far from perfect, since the exact numbers can be a bit off. Nevertheless, the highs and lows are quite on target. Alas, CNN does not explain exactly how the index is calculated.
Feedback is most welcome!
Explanation: Extreme index values (e. g. <10, >80) can be a signal for a turnaround because there are not much buyers (>80, too much greed) or sellers (<10, too much fear) left.
릴리즈 노트
German translationDeutsch:
Dies ist ein Versuch, den "Fear & Greed Index" von CNN darzustellen: money.cnn.com/data/fear-and-greed/
Er ist definitiv noch nicht perfekt, da die exakten Zahlen ein wenig abweichen können. Die Hochs und Tiefs passen aber recht gut. Leider gibt CNN die genaue Berechnung des Indices nicht preis.
Feedback ist sehr willkommen!
Erklärung: Extremwerte (z. B. < 10, > 80) können ein Signal für Umkehrungen sein, weil nicht mehr viele Käufer (> 80, zu viel Gier) oder Verkäufer (< 10, zu viel Angst) übrig sind.
릴리즈 노트
English:minor changes to get a better similarity with the original index
Deutsch:
kleinere Änderungen, um den Original-Index näher zu kommen
릴리즈 노트
English:
Fixed the Put/Call-Ratio because TradingView changed the reference.
Deutsch:
Änderung im Put/Call-Ratio, weil TradingView die Referenzierung geändert hat.
오픈 소스 스크립트
트레이딩뷰의 진정한 정신에 따라, 이 스크립트의 작성자는 이를 오픈소스로 공개하여 트레이더들이 기능을 검토하고 검증할 수 있도록 했습니다. 작성자에게 찬사를 보냅니다! 이 코드는 무료로 사용할 수 있지만, 코드를 재게시하는 경우 하우스 룰이 적용된다는 점을 기억하세요.
면책사항
해당 정보와 게시물은 금융, 투자, 트레이딩 또는 기타 유형의 조언이나 권장 사항으로 간주되지 않으며, 트레이딩뷰에서 제공하거나 보증하는 것이 아닙니다. 자세한 내용은 이용 약관을 참조하세요.
오픈 소스 스크립트
트레이딩뷰의 진정한 정신에 따라, 이 스크립트의 작성자는 이를 오픈소스로 공개하여 트레이더들이 기능을 검토하고 검증할 수 있도록 했습니다. 작성자에게 찬사를 보냅니다! 이 코드는 무료로 사용할 수 있지만, 코드를 재게시하는 경우 하우스 룰이 적용된다는 점을 기억하세요.
면책사항
해당 정보와 게시물은 금융, 투자, 트레이딩 또는 기타 유형의 조언이나 권장 사항으로 간주되지 않으며, 트레이딩뷰에서 제공하거나 보증하는 것이 아닙니다. 자세한 내용은 이용 약관을 참조하세요.