PROTECTED SOURCE SCRIPT
Price Percent Oscillator
The Percentage Price Oscillator(PPO) is a momentum oscillator that measures the difference between two moving averages as a percentage of the larger moving average. Similar to the Moving Average Convergence/Divergence(MACD), the PPO is comprised of a signal line, a histogram and a centerline. Signals are generated with signal line crossovers, centerline crossovers, and divergences. Because these signals are no different than those associated with MACD, this indicator can be read exactly as the MACD is read. The main differences between the PPO and MACD are: 1) PPO readings are not subject to the price level of the security. 2) PPO readings for different securities can be compared, even when there are large differences in the price. MACD readings for different securities cannot be compared when there are large differences in price.
Calculations:
Percentage Price Oscillator (PPO): {(12-day EMA - 26-day EMA)/26-day EMA} x 100
Signal Line: 9-day EMA of PPO
PPO Histogram: PPO - Signal Line
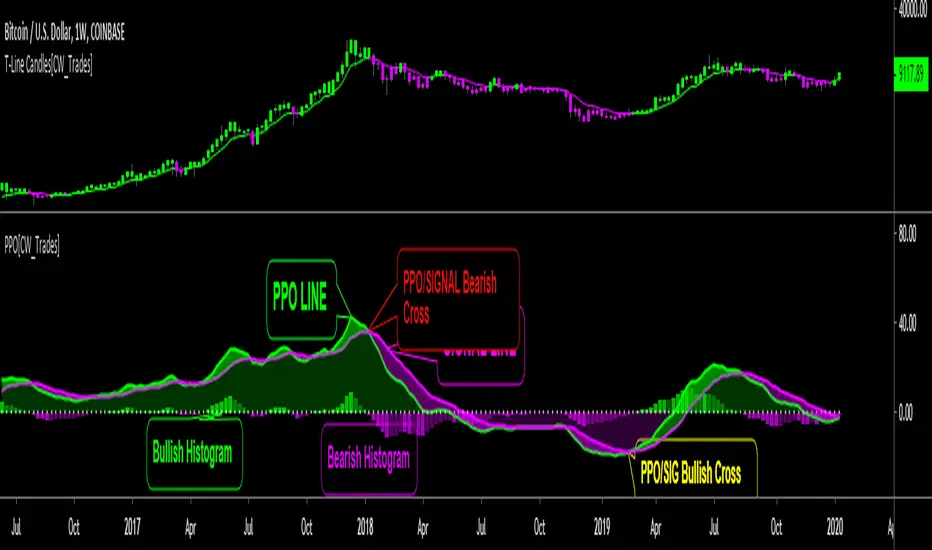
This PPO indicator retains standard PPO settings. Additions to this indicator are: 1) filling the space between the PPO LINE and SIGNAL LINE. Space is green when PPO is above SIGNAL, purple when PPO is below SIGNAL. The color of the space between PPO and SIGNAL is used to define short-term momentum for price(green is positive momentum, pink is negative momentum). 2) filling the space between the PPO LINE and CENTER LINE(0 LEVEL). This space is filled green when the PPO is above the CENTER LINE and pink when the PPO is below the CENTER LINE. Green in this area indicates positive momentum in the intermediate-term while pink indicates negative momentum in the intermediate-term.
Calculations:
Percentage Price Oscillator (PPO): {(12-day EMA - 26-day EMA)/26-day EMA} x 100
Signal Line: 9-day EMA of PPO
PPO Histogram: PPO - Signal Line
This PPO indicator retains standard PPO settings. Additions to this indicator are: 1) filling the space between the PPO LINE and SIGNAL LINE. Space is green when PPO is above SIGNAL, purple when PPO is below SIGNAL. The color of the space between PPO and SIGNAL is used to define short-term momentum for price(green is positive momentum, pink is negative momentum). 2) filling the space between the PPO LINE and CENTER LINE(0 LEVEL). This space is filled green when the PPO is above the CENTER LINE and pink when the PPO is below the CENTER LINE. Green in this area indicates positive momentum in the intermediate-term while pink indicates negative momentum in the intermediate-term.
보호된 스크립트입니다
이 스크립트는 비공개 소스로 게시됩니다. 하지만 이를 자유롭게 제한 없이 사용할 수 있습니다 – 자세한 내용은 여기에서 확인하세요.
면책사항
해당 정보와 게시물은 금융, 투자, 트레이딩 또는 기타 유형의 조언이나 권장 사항으로 간주되지 않으며, 트레이딩뷰에서 제공하거나 보증하는 것이 아닙니다. 자세한 내용은 이용 약관을 참조하세요.
보호된 스크립트입니다
이 스크립트는 비공개 소스로 게시됩니다. 하지만 이를 자유롭게 제한 없이 사용할 수 있습니다 – 자세한 내용은 여기에서 확인하세요.
면책사항
해당 정보와 게시물은 금융, 투자, 트레이딩 또는 기타 유형의 조언이나 권장 사항으로 간주되지 않으며, 트레이딩뷰에서 제공하거나 보증하는 것이 아닙니다. 자세한 내용은 이용 약관을 참조하세요.