OPEN-SOURCE SCRIPT
Mehul - ADX Zero Lag
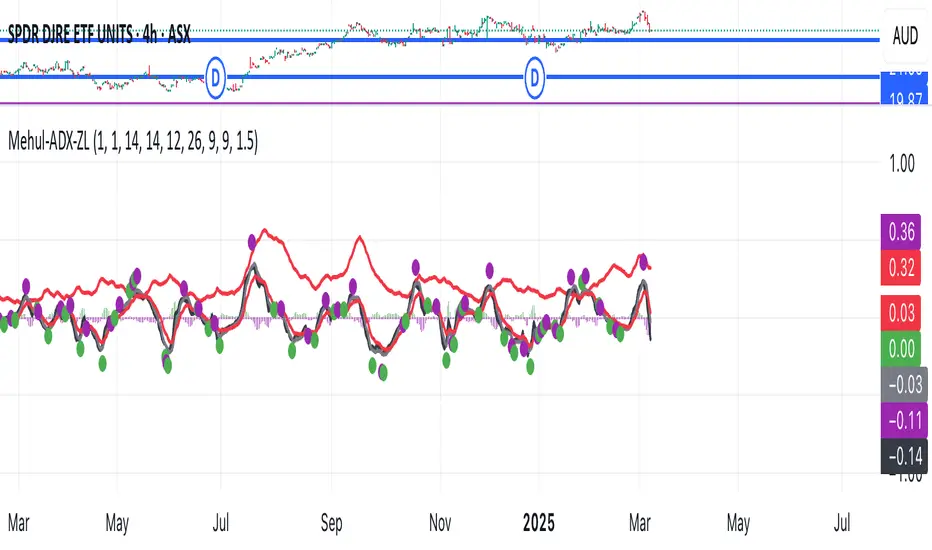
This script combines two popular technical indicators into a single visualization:
1. **Average Directional Index (ADX)**:
- Measures trend strength on a scale from 0-100 (now normalized to 0-1 by dividing by 100)
- Displayed as a red line
- Adjustable smoothing and length parameters
2. **Zero Lag MACD (Modified Moving Average Convergence Divergence)**:
- An enhanced version of the traditional MACD with reduced lag
- Shows the relationship between fast and slow moving averages
- Main components include:
- MACD line (black)
- Signal line (gray)
- Histogram (green for positive, purple for negative)
- EMA of the MACD line (red)
- Optional crossing dots
Key features of the combined indicator:
- **Scale Adjustment**: Both indicators can be scaled independently (adxScale and macdScale parameters)
- **Visibility Toggles**: Each indicator can be shown or hidden
- **Advanced Customization**: Parameters for both indicators can be fine-tuned
- **Algorithm Selection**: Option to choose between the "Glaz" algorithm or the "real" zero lag algorithm
- **Display Options**: Toggles for visualization elements like crossing dots
The most significant technical aspect is that both indicators are displayed in the same pane with compatible scaling, achieved by normalizing the ADX values and applying user-defined scale factors to both indicators.
This combined indicator is designed to give traders a comprehensive view of both trend strength (from ADX) and momentum/direction (from Zero Lag MACD) in a single, easy-to-read visualization.
오픈 소스 스크립트
트레이딩뷰의 진정한 정신에 따라, 이 스크립트의 작성자는 이를 오픈소스로 공개하여 트레이더들이 기능을 검토하고 검증할 수 있도록 했습니다. 작성자에게 찬사를 보냅니다! 이 코드는 무료로 사용할 수 있지만, 코드를 재게시하는 경우 하우스 룰이 적용된다는 점을 기억하세요.
면책사항
해당 정보와 게시물은 금융, 투자, 트레이딩 또는 기타 유형의 조언이나 권장 사항으로 간주되지 않으며, 트레이딩뷰에서 제공하거나 보증하는 것이 아닙니다. 자세한 내용은 이용 약관을 참조하세요.
오픈 소스 스크립트
트레이딩뷰의 진정한 정신에 따라, 이 스크립트의 작성자는 이를 오픈소스로 공개하여 트레이더들이 기능을 검토하고 검증할 수 있도록 했습니다. 작성자에게 찬사를 보냅니다! 이 코드는 무료로 사용할 수 있지만, 코드를 재게시하는 경우 하우스 룰이 적용된다는 점을 기억하세요.
면책사항
해당 정보와 게시물은 금융, 투자, 트레이딩 또는 기타 유형의 조언이나 권장 사항으로 간주되지 않으며, 트레이딩뷰에서 제공하거나 보증하는 것이 아닙니다. 자세한 내용은 이용 약관을 참조하세요.