OPEN-SOURCE SCRIPT
VDVA - Volume Delta Volatility Amplifier
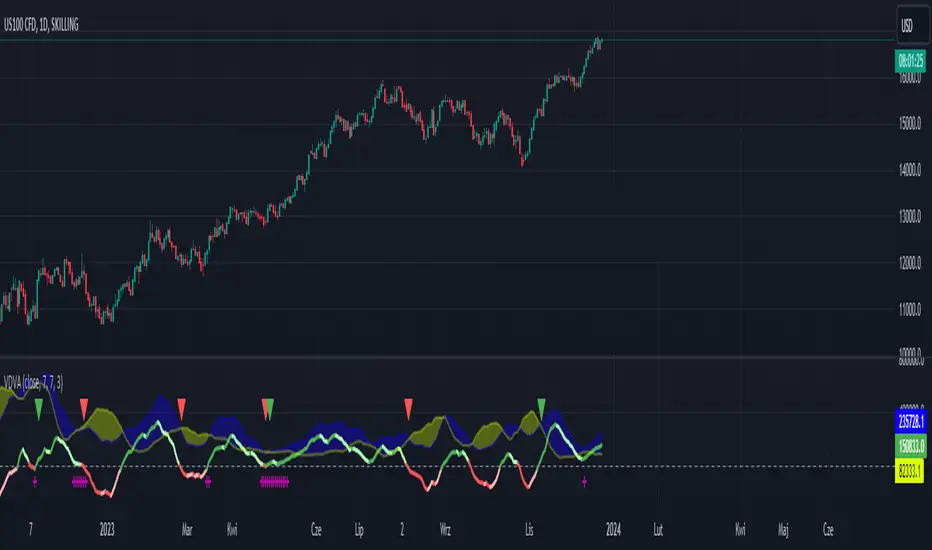
This script defines an indicator named VDVA (Volume Delta Volatility Amplifier), which combines volume delta (the difference between volume up and volume down) and volatility (ATR) into one line. This line is then smoothed using a moving average and compared with the zero level and a shorter-period moving average. The script also plots shapes when the rate of change of the line exceeds the first standard deviation. Moreover, the script uses Bollinger Bands and Keltner Channels to determine the squeeze condition, which is a signal of a potential breakout. Finally, the script plots two bar charts that show the volume up and volume down multiplied by ATR.
dark green line - bullish
light green line - potential bearish
dark red line - bearish
light red line - potential bullish
blue cloud - bullish
yellow cloud - bearish
red triangle - bearish entry
green triangle - bullish entry
purple cross - squeeze
dark green line - bullish
light green line - potential bearish
dark red line - bearish
light red line - potential bullish
blue cloud - bullish
yellow cloud - bearish
red triangle - bearish entry
green triangle - bullish entry
purple cross - squeeze
오픈 소스 스크립트
트레이딩뷰의 진정한 정신에 따라, 이 스크립트의 작성자는 이를 오픈소스로 공개하여 트레이더들이 기능을 검토하고 검증할 수 있도록 했습니다. 작성자에게 찬사를 보냅니다! 이 코드는 무료로 사용할 수 있지만, 코드를 재게시하는 경우 하우스 룰이 적용된다는 점을 기억하세요.
면책사항
해당 정보와 게시물은 금융, 투자, 트레이딩 또는 기타 유형의 조언이나 권장 사항으로 간주되지 않으며, 트레이딩뷰에서 제공하거나 보증하는 것이 아닙니다. 자세한 내용은 이용 약관을 참조하세요.
오픈 소스 스크립트
트레이딩뷰의 진정한 정신에 따라, 이 스크립트의 작성자는 이를 오픈소스로 공개하여 트레이더들이 기능을 검토하고 검증할 수 있도록 했습니다. 작성자에게 찬사를 보냅니다! 이 코드는 무료로 사용할 수 있지만, 코드를 재게시하는 경우 하우스 룰이 적용된다는 점을 기억하세요.
면책사항
해당 정보와 게시물은 금융, 투자, 트레이딩 또는 기타 유형의 조언이나 권장 사항으로 간주되지 않으며, 트레이딩뷰에서 제공하거나 보증하는 것이 아닙니다. 자세한 내용은 이용 약관을 참조하세요.