PROTECTED SOURCE SCRIPT
Strong Indicator for ISM Services PMI XAUUSD (mtbr)
Description:
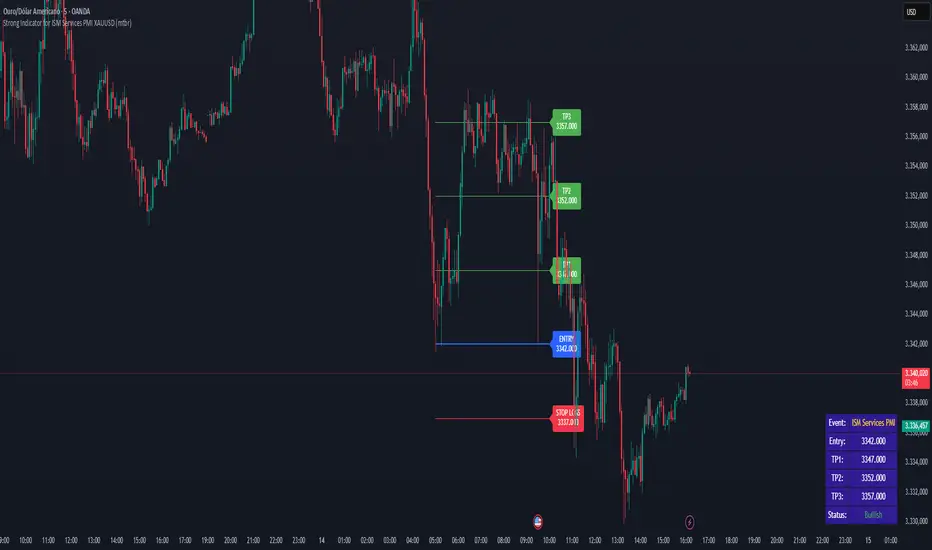
This indicator is designed to help traders visualize entry levels, targets (TP1, TP2, TP3), and stop loss around the ISM Services PMI economic event for the XAUUSD asset. It provides a clear reference for potential market movements based on the event’s surprise and market direction (Bullish or Bearish).
Key Features:
Customizable event date and time:
You can set the exact year, month, day, hour, and minute of the event so that the lines and labels appear precisely on the corresponding bar.
Surprise calculation and market direction:
The difference between Actual and Forecast is calculated and displayed in the table as Bullish, Bearish, or Neutral.
Price levels in pips:
Entry (Entry), three targets (TP1, TP2, TP3), and Stop Loss (SL) can be set in pips relative to the entry price.
Each level has independent lines and labels, which update only if the corresponding input value changes, keeping the rest of the chart intact.
Clear visualization on the chart:
Colored lines:
Entry → blue
TPs → green
Stop Loss → red
Vertical event line → orange, highlighting the release moment.
Integrated informative table:
Displays:
Event name
Entry price
TP1, TP2, TP3
Market direction status (Bullish/Bearish/Neutral)
Table colors reflect market direction (green for bullish, red for bearish, gray for neutral).
How to use the script:
Add the indicator to the XAUUSD chart.
Set the ISM Services PMI event date and time in the input panel.
Enter the Entry Price and pip values for TP1, TP2, TP3, and SL according to your strategy.
The indicator will automatically draw lines and labels on the chart and update the table with the event details and market direction.
Whenever you change an input value, only the corresponding line and label will update, keeping other levels fixed.
Important Notes:
The indicator does not perform automatic trades; it serves as a visual reference for trading decisions.
Ensure the event timezone is set correctly to match the release time in your local time zone.
Use in combination with your own risk management and trading strategy.
TradingView publication rules followed:
Full instructions for using the indicator
Clear explanation of inputs and settings
Description of lines and label behavior
Disclaimer that the script is educational and visual, not automated trading
보호된 스크립트입니다
이 스크립트는 비공개 소스로 게시됩니다. 하지만 이를 자유롭게 제한 없이 사용할 수 있습니다 – 자세한 내용은 여기에서 확인하세요.
면책사항
해당 정보와 게시물은 금융, 투자, 트레이딩 또는 기타 유형의 조언이나 권장 사항으로 간주되지 않으며, 트레이딩뷰에서 제공하거나 보증하는 것이 아닙니다. 자세한 내용은 이용 약관을 참조하세요.
보호된 스크립트입니다
이 스크립트는 비공개 소스로 게시됩니다. 하지만 이를 자유롭게 제한 없이 사용할 수 있습니다 – 자세한 내용은 여기에서 확인하세요.
면책사항
해당 정보와 게시물은 금융, 투자, 트레이딩 또는 기타 유형의 조언이나 권장 사항으로 간주되지 않으며, 트레이딩뷰에서 제공하거나 보증하는 것이 아닙니다. 자세한 내용은 이용 약관을 참조하세요.