PROTECTED SOURCE SCRIPT
[XIDEN] Reversal Scanner
Xiden's reversal scanner is based on SMA.
It gives you visual reversal zones and possible entries to enter a reversal trade.
We always try to keep the chart clean, so we didn't go back on visuals, just essentials.
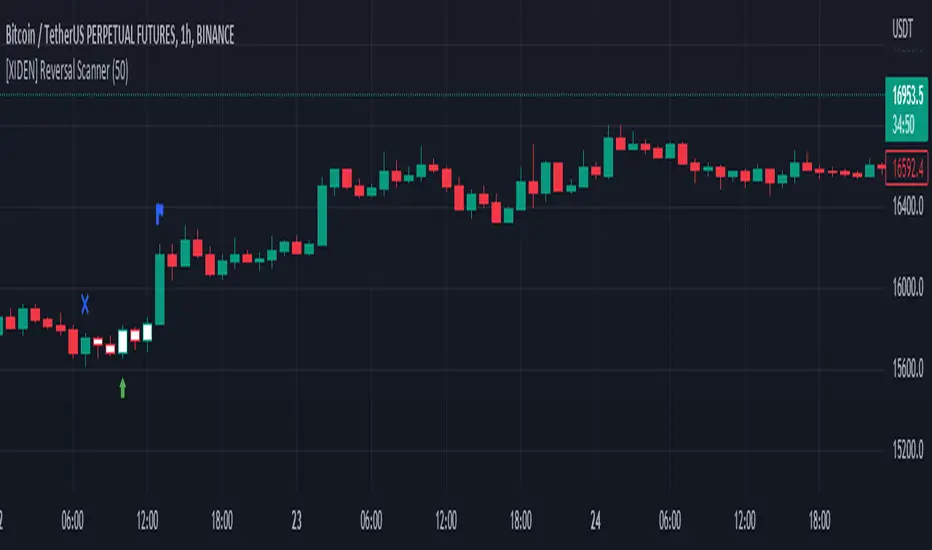
Here is a bullish example:

The blue cross indicates the start of a bullish reversal zone.
The blue flag indicates the end of the bullish reversal zone.
The green arrow marks a possible long entry.
Here is a bearish example:

Again:
The blue cross indicates the start of a bearish reversal zone.
The blue flag indicates the end of the bearish reversal zone.
The red arrow marks a possible short entry.
Don't use this tool as a standalone indicator to trade, always DYOR and use other factors to confirm a possible reversal.
It gives you visual reversal zones and possible entries to enter a reversal trade.
We always try to keep the chart clean, so we didn't go back on visuals, just essentials.
Here is a bullish example:
The blue cross indicates the start of a bullish reversal zone.
The blue flag indicates the end of the bullish reversal zone.
The green arrow marks a possible long entry.
Here is a bearish example:
Again:
The blue cross indicates the start of a bearish reversal zone.
The blue flag indicates the end of the bearish reversal zone.
The red arrow marks a possible short entry.
Don't use this tool as a standalone indicator to trade, always DYOR and use other factors to confirm a possible reversal.
보호된 스크립트입니다
이 스크립트는 비공개 소스로 게시됩니다. 하지만 이를 자유롭게 제한 없이 사용할 수 있습니다 – 자세한 내용은 여기에서 확인하세요.
면책사항
해당 정보와 게시물은 금융, 투자, 트레이딩 또는 기타 유형의 조언이나 권장 사항으로 간주되지 않으며, 트레이딩뷰에서 제공하거나 보증하는 것이 아닙니다. 자세한 내용은 이용 약관을 참조하세요.
면책사항
해당 정보와 게시물은 금융, 투자, 트레이딩 또는 기타 유형의 조언이나 권장 사항으로 간주되지 않으며, 트레이딩뷰에서 제공하거나 보증하는 것이 아닙니다. 자세한 내용은 이용 약관을 참조하세요.