PROTECTED SOURCE SCRIPT
업데이트됨 multi RSI channel for divergence / wave analysis
This is an indicator that will make analysis using RSI much easier!
This indicator is basically an RSI, that uses the concept of bollingerbands, and draws channel that corresponds with the real RSI value.
With this script, you will be able to
1.spot divergences visually, and much easier (rsi channel is set to 35/65-white 30/70-yellow 20/80-orange 15/85-red)
2.analyze the wave easier with the guidance of labels printed
For those people who use RSI alot, you will be able to use this indicator for spotting divergence scenarios before the divergence forms,
and with the multi-rsi channel & help of label, you will be able to visually know that the divergence has formed.
this indicator will help guide you to read RSI indicator much better, and I personally don't think that you need extra RSI indicator(default),
because this is much more intuitive, and you get all the benefits of RSI as well.
hope this helps someone like me who really wanted to use RSI channel more professionally!
릴리즈 노트
도형님 코드 수정본릴리즈 노트
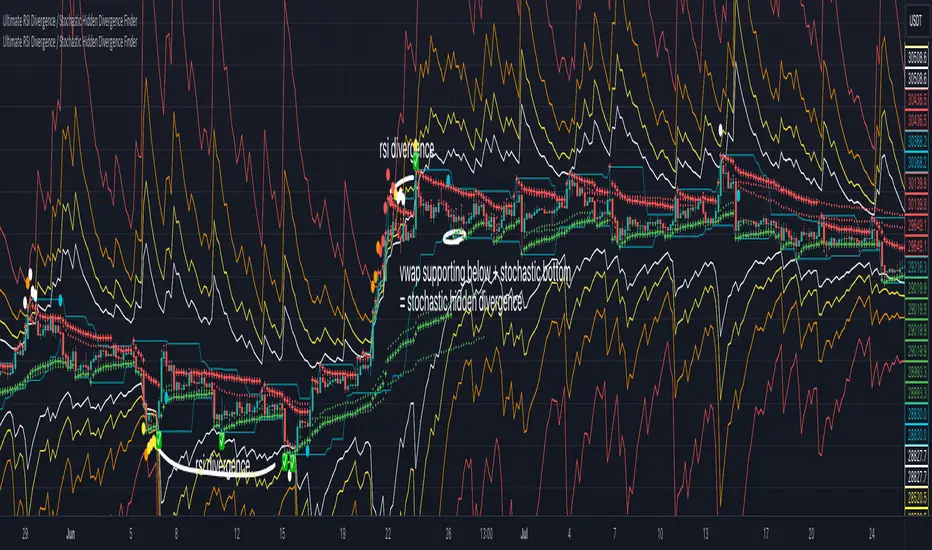
the best divergence indicator IMO.Regular divergence uses rsi 11 period, and each level is defined as
75, 80, 85, 90 (white,yellow,orange,red)
aqua circle is there to remind you that it has made enough pullback for divergence to be strong enough.
I recommend at least rsi of 85 or more for the highest RSI value (orange) and then create a regular divergence (green checkbox)
for hidden divergence, I think that stochastic indicator does the trick, and basically stochastic indicator is the same concept as donchian channel, so I'm using donchian channel as well as vwap in order to figure out if there exist a supporting vwap and the price touching the donchian channel. this means that there exist hidden divergence, and the quality is decided by the supporting vwap and overall structure of the price.
보호된 스크립트입니다
이 스크립트는 비공개 소스로 게시됩니다. 하지만 이를 자유롭게 제한 없이 사용할 수 있습니다 – 자세한 내용은 여기에서 확인하세요.
면책사항
해당 정보와 게시물은 금융, 투자, 트레이딩 또는 기타 유형의 조언이나 권장 사항으로 간주되지 않으며, 트레이딩뷰에서 제공하거나 보증하는 것이 아닙니다. 자세한 내용은 이용 약관을 참조하세요.
보호된 스크립트입니다
이 스크립트는 비공개 소스로 게시됩니다. 하지만 이를 자유롭게 제한 없이 사용할 수 있습니다 – 자세한 내용은 여기에서 확인하세요.
면책사항
해당 정보와 게시물은 금융, 투자, 트레이딩 또는 기타 유형의 조언이나 권장 사항으로 간주되지 않으며, 트레이딩뷰에서 제공하거나 보증하는 것이 아닙니다. 자세한 내용은 이용 약관을 참조하세요.