OPEN-SOURCE SCRIPT
Dynamic Support, Resistance & Fibo by Reza
Dynamic Support, Resistance & Fibonacci Levels by Reza
This Pine Script indicator dynamically calculates and plots significant support and resistance levels, along with key Fibonacci retracement levels, based on recent price action. It provides traders with essential tools to identify crucial levels on the chart that may influence future price movements.
Key Features:
Dynamic Support and Resistance Lines:
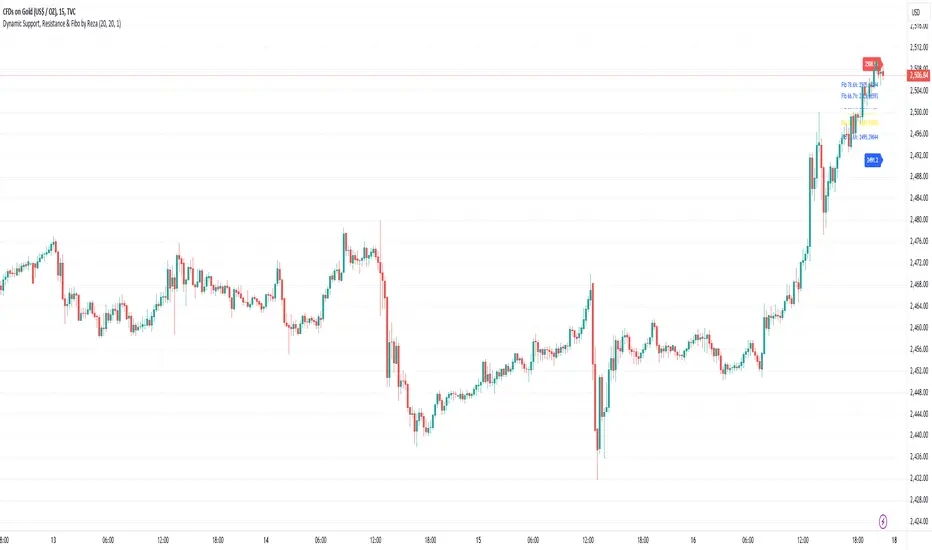
The script identifies recent swing highs and swing lows within a customizable lookback period to determine dynamic support and resistance levels.
These levels are plotted as horizontal lines (blue for support, red for resistance) and are updated in real-time to reflect changes in the price structure.
Labels next to each line display the exact price level of the support and resistance, making it easy to identify them at a glance.
Fibonacci Retracement Levels:
The script calculates and plots Fibonacci retracement levels (23.6%, 38.2%, 50.0%, 55.9%, 61.8%, 66.7%, and 78.6%) between the identified support and resistance levels.
These Fibonacci levels are plotted as dotted lines, with customizable colors and labels for clarity.
The Fibonacci levels provide traders with potential retracement and extension levels, which are commonly used to predict price reversals, pullbacks, and continuation zones.
Customization:
Users can adjust the lookback period for swing high and swing low calculations to suit different trading styles and market conditions.
The script allows traders to enable or disable Fibonacci levels and choose whether or not to remove the background color of the labels for cleaner chart visuals.
Line width, highlight colors, and label colors are fully customizable for better integration with various chart styles and themes.
Real-Time Dashboard:
The indicator includes a real-time dashboard that calculates and displays the next potential target based on current market conditions, including potential retracement or continuation targets.
The dashboard dynamically updates based on trend direction and Fibonacci zones, giving traders valuable insights into potential price objectives.
How to Use:
This indicator is suitable for multiple timeframes, helping traders identify key levels in real-time as the market evolves.
By providing support and resistance zones along with Fibonacci retracement levels, this script offers a powerful combination of technical analysis tools for both novice and experienced traders.
The dynamic calculations help traders spot potential areas for entering or exiting trades, placing stop-loss levels, and identifying profit-taking zones.
Ideal for:
Traders who want to use support and resistance levels for trade planning.
Fibonacci enthusiasts looking for automated level plotting.
Anyone seeking to identify key price levels in real-time across different timeframes.
Script Author:
Reza – Bringing you dynamic, real-time support, resistance, and Fibonacci level plotting for more effective trading decisions.
This Pine Script indicator dynamically calculates and plots significant support and resistance levels, along with key Fibonacci retracement levels, based on recent price action. It provides traders with essential tools to identify crucial levels on the chart that may influence future price movements.
Key Features:
Dynamic Support and Resistance Lines:
The script identifies recent swing highs and swing lows within a customizable lookback period to determine dynamic support and resistance levels.
These levels are plotted as horizontal lines (blue for support, red for resistance) and are updated in real-time to reflect changes in the price structure.
Labels next to each line display the exact price level of the support and resistance, making it easy to identify them at a glance.
Fibonacci Retracement Levels:
The script calculates and plots Fibonacci retracement levels (23.6%, 38.2%, 50.0%, 55.9%, 61.8%, 66.7%, and 78.6%) between the identified support and resistance levels.
These Fibonacci levels are plotted as dotted lines, with customizable colors and labels for clarity.
The Fibonacci levels provide traders with potential retracement and extension levels, which are commonly used to predict price reversals, pullbacks, and continuation zones.
Customization:
Users can adjust the lookback period for swing high and swing low calculations to suit different trading styles and market conditions.
The script allows traders to enable or disable Fibonacci levels and choose whether or not to remove the background color of the labels for cleaner chart visuals.
Line width, highlight colors, and label colors are fully customizable for better integration with various chart styles and themes.
Real-Time Dashboard:
The indicator includes a real-time dashboard that calculates and displays the next potential target based on current market conditions, including potential retracement or continuation targets.
The dashboard dynamically updates based on trend direction and Fibonacci zones, giving traders valuable insights into potential price objectives.
How to Use:
This indicator is suitable for multiple timeframes, helping traders identify key levels in real-time as the market evolves.
By providing support and resistance zones along with Fibonacci retracement levels, this script offers a powerful combination of technical analysis tools for both novice and experienced traders.
The dynamic calculations help traders spot potential areas for entering or exiting trades, placing stop-loss levels, and identifying profit-taking zones.
Ideal for:
Traders who want to use support and resistance levels for trade planning.
Fibonacci enthusiasts looking for automated level plotting.
Anyone seeking to identify key price levels in real-time across different timeframes.
Script Author:
Reza – Bringing you dynamic, real-time support, resistance, and Fibonacci level plotting for more effective trading decisions.
오픈 소스 스크립트
트레이딩뷰의 진정한 정신에 따라, 이 스크립트의 작성자는 이를 오픈소스로 공개하여 트레이더들이 기능을 검토하고 검증할 수 있도록 했습니다. 작성자에게 찬사를 보냅니다! 이 코드는 무료로 사용할 수 있지만, 코드를 재게시하는 경우 하우스 룰이 적용된다는 점을 기억하세요.
면책사항
해당 정보와 게시물은 금융, 투자, 트레이딩 또는 기타 유형의 조언이나 권장 사항으로 간주되지 않으며, 트레이딩뷰에서 제공하거나 보증하는 것이 아닙니다. 자세한 내용은 이용 약관을 참조하세요.
오픈 소스 스크립트
트레이딩뷰의 진정한 정신에 따라, 이 스크립트의 작성자는 이를 오픈소스로 공개하여 트레이더들이 기능을 검토하고 검증할 수 있도록 했습니다. 작성자에게 찬사를 보냅니다! 이 코드는 무료로 사용할 수 있지만, 코드를 재게시하는 경우 하우스 룰이 적용된다는 점을 기억하세요.
면책사항
해당 정보와 게시물은 금융, 투자, 트레이딩 또는 기타 유형의 조언이나 권장 사항으로 간주되지 않으며, 트레이딩뷰에서 제공하거나 보증하는 것이 아닙니다. 자세한 내용은 이용 약관을 참조하세요.