OPEN-SOURCE SCRIPT
Returns Stationarity Analysis (YavuzAkbay)

This indicator analyzes the stationarity of a stock's price returns over time. Stationarity is an important property of time series data, as it determines the validity of statistical analysis and forecasting methods.
The indicator provides several visual cues to help assess the stationarity of the price returns:
The indicator also includes the following features:
This indicator can be a useful tool for stock market analysts and traders to identify potential changes in the underlying dynamics of a stock's price behavior, which may have implications for forecasting, risk management, and investment strategies.
The indicator provides several visual cues to help assess the stationarity of the price returns:
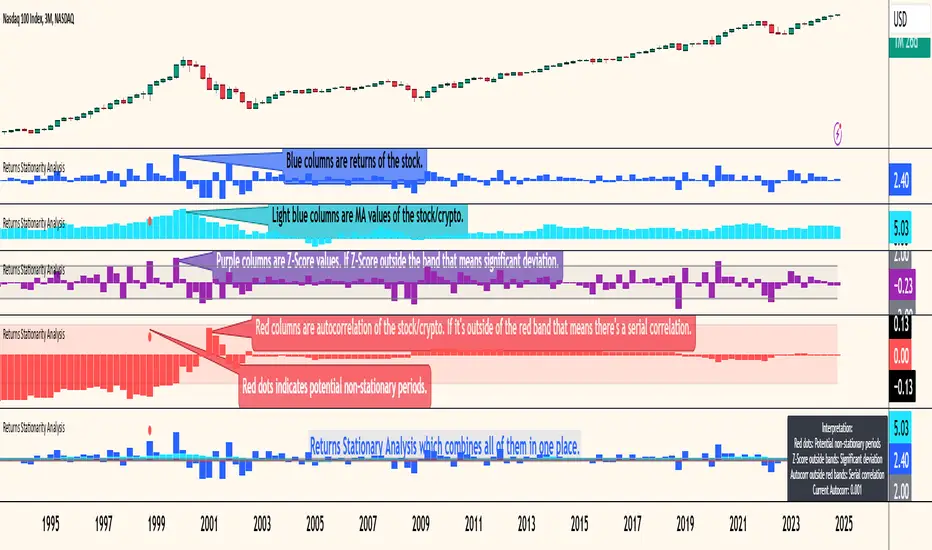
- Price Returns: Displays the daily percentage change in the stock's closing price.
- Moving Average: Shows the smoothed trend of the price returns using a simple moving average.
- Z-Score: Calculates the standardized z-score of the price returns, highlighting periods of significant deviation from the mean.
- Autocorrelation: Plots the autocorrelation of the price returns, which measures the persistence or "memory" in the time series. High autocorrelation suggests non-stationarity.
The indicator also includes the following features:
- Customizable lookback period and smoothing window for the moving statistics.
- Lag parameter for the autocorrelation calculation.
- Shaded bands to indicate the significance levels for the z-score and autocorrelation.
- Visual signals (red dots) to highlight periods that are potentially non-stationary, based on a combination of high z-score and autocorrelation.
- Informative labels to guide the interpretation of the results.
This indicator can be a useful tool for stock market analysts and traders to identify potential changes in the underlying dynamics of a stock's price behavior, which may have implications for forecasting, risk management, and investment strategies.
오픈 소스 스크립트
진정한 TradingView 정신에 따라, 이 스크립트의 저자는 트레이더들이 이해하고 검증할 수 있도록 오픈 소스로 공개했습니다. 저자에게 박수를 보냅니다! 이 코드는 무료로 사용할 수 있지만, 출판물에서 이 코드를 재사용하는 것은 하우스 룰에 의해 관리됩니다. 님은 즐겨찾기로 이 스크립트를 차트에서 쓸 수 있습니다.
차트에 이 스크립트를 사용하시겠습니까?
면책사항
이 정보와 게시물은 TradingView에서 제공하거나 보증하는 금융, 투자, 거래 또는 기타 유형의 조언이나 권고 사항을 의미하거나 구성하지 않습니다. 자세한 내용은 이용 약관을 참고하세요.