OPEN-SOURCE SCRIPT
업데이트됨 FullPac4Trader (I.Denis)

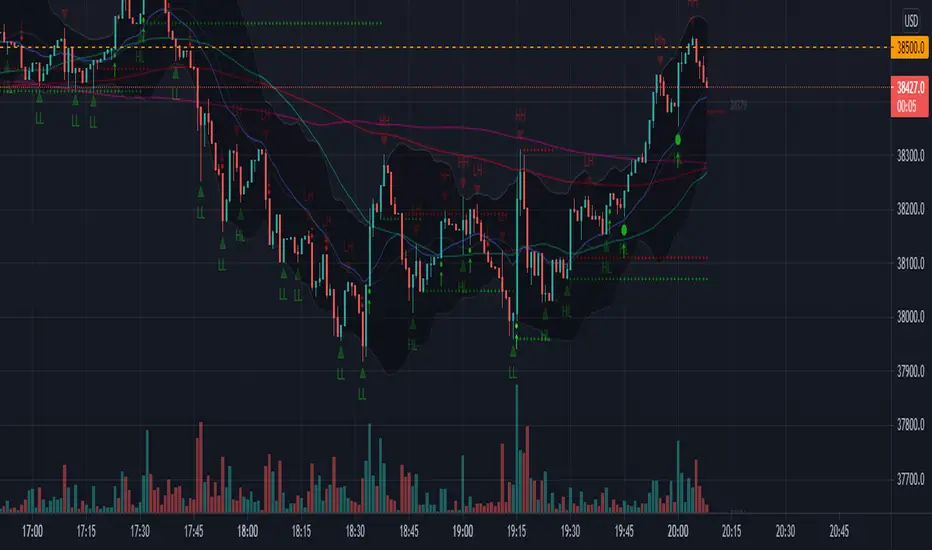
The script combines the three most important indicators on the chart.
1. A set of six moving averages ( EMA and SMA ), which can be turned on and adjusted at your discretion.
2. Indication of support and resistance levels, calculated according to the Bollinger scheme.
3. Pivot Point and the nearest goals using the Floor method with the possibility of selecting a time period.
The script version is v.1 (beta)
The development of this script will continue. Feedback and suggestions are welcome.
릴리즈 노트
Version 2.0The following functions have been added to this version of the script:
1. Calculation of pivot points by Fibonacci levels.
2. Display of the current pivot points next to the last bar.
3. Switch to showing historical pivot points.
4. Indicator of Bollinger bands.
5. Display of reversal bars and their marking.
6. Displaying the Fractal Chaos Channel and marking the breakdown of its boundaries.
릴리즈 노트
Version 2.1The following functions have been added to this version of the script:
1. Added the ability to put an alert on the intersection of Channels of Chaos - BUY! and SELL!
2. Added an indication of the current period on the Pivot Points level labels.
릴리즈 노트
v.2.2 - Fixed an error when plotting the historical chart of pivot point levels.오픈 소스 스크립트
트레이딩뷰의 진정한 정신에 따라, 이 스크립트의 작성자는 이를 오픈소스로 공개하여 트레이더들이 기능을 검토하고 검증할 수 있도록 했습니다. 작성자에게 찬사를 보냅니다! 이 코드는 무료로 사용할 수 있지만, 코드를 재게시하는 경우 하우스 룰이 적용된다는 점을 기억하세요.
면책사항
해당 정보와 게시물은 금융, 투자, 트레이딩 또는 기타 유형의 조언이나 권장 사항으로 간주되지 않으며, 트레이딩뷰에서 제공하거나 보증하는 것이 아닙니다. 자세한 내용은 이용 약관을 참조하세요.
오픈 소스 스크립트
트레이딩뷰의 진정한 정신에 따라, 이 스크립트의 작성자는 이를 오픈소스로 공개하여 트레이더들이 기능을 검토하고 검증할 수 있도록 했습니다. 작성자에게 찬사를 보냅니다! 이 코드는 무료로 사용할 수 있지만, 코드를 재게시하는 경우 하우스 룰이 적용된다는 점을 기억하세요.
면책사항
해당 정보와 게시물은 금융, 투자, 트레이딩 또는 기타 유형의 조언이나 권장 사항으로 간주되지 않으며, 트레이딩뷰에서 제공하거나 보증하는 것이 아닙니다. 자세한 내용은 이용 약관을 참조하세요.