This indicator compares buyers demand with sellers supply volumes and calculates which prevails. Therefore it only works if volume is published. Buyers demand is assumed for a period in which a higher high is reached with more volume. Sellers supply is recognized by a lower low combined with more volume.
The average of sellers supplies is subtracted from buyers demand, the result is graded because a statement like “The faith in this period was ## percent” has no meaning. We can conclude to more faith and less faith but not represent it in some exact number.
This indicator assigns the following grades:
Very high faith graduated as 8
High faith as 6
Good faith as 4
Some Faith as 2
Little Faith as 1
Neither Faith nor Distrust as zero
Self Protection Distrust graduated as -8
Fear Distrust as -6
Anxiety Distrust as -4
Suspicion Distrust as -2
Doubt Distrust as -1
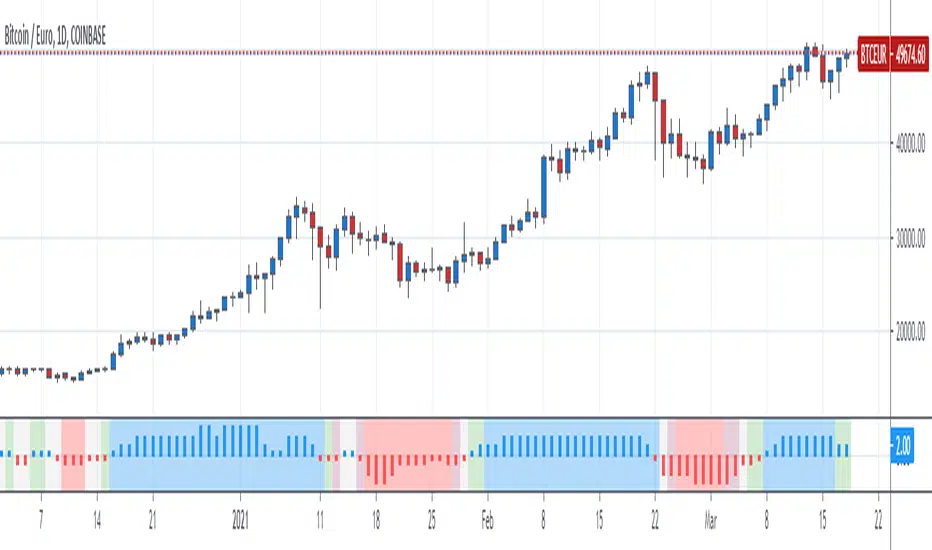
It is presented as a histogram with blue staves pointing up (meaning faith) and red staves pointing down (meaning distrust)
The background is colored using the Hull Agreement Indicator (Hullag), which I published before. Hullag graduates price movements in five grades to which it assigns a background color. These are as follows:
grade 2: blue, clear upward movement
grade 1: green, some upward movement
grade 0: silver, neither upward nor downward movement
grade -1: maroon, some downward movement
grad -2: red, clear downward movement.
Use of the Faith Indicator:
The indicator shows price action/momentum as a background color and volume action analyzed as a grade of faith in the form of a histogram. Usually faith comes together with rising prices (blue/green background) and distrust with lowering prices (red/maroon background), however contrarian situations occur, e.g. lowering prices while the market has good faith. These can be explained by minority sellers who act contrary to the feelings in the market. You can then decide that this might be an unsustainable move of the quotes.
If the faith indicator confirms the price movement, you might assume that the move is meaningful and will go further. Also if you see faith diminishing you might assume that the move is coming to an end and the tide is going to turn.
The average of sellers supplies is subtracted from buyers demand, the result is graded because a statement like “The faith in this period was ## percent” has no meaning. We can conclude to more faith and less faith but not represent it in some exact number.
This indicator assigns the following grades:
Very high faith graduated as 8
High faith as 6
Good faith as 4
Some Faith as 2
Little Faith as 1
Neither Faith nor Distrust as zero
Self Protection Distrust graduated as -8
Fear Distrust as -6
Anxiety Distrust as -4
Suspicion Distrust as -2
Doubt Distrust as -1
It is presented as a histogram with blue staves pointing up (meaning faith) and red staves pointing down (meaning distrust)
The background is colored using the Hull Agreement Indicator (Hullag), which I published before. Hullag graduates price movements in five grades to which it assigns a background color. These are as follows:
grade 2: blue, clear upward movement
grade 1: green, some upward movement
grade 0: silver, neither upward nor downward movement
grade -1: maroon, some downward movement
grad -2: red, clear downward movement.
Use of the Faith Indicator:
The indicator shows price action/momentum as a background color and volume action analyzed as a grade of faith in the form of a histogram. Usually faith comes together with rising prices (blue/green background) and distrust with lowering prices (red/maroon background), however contrarian situations occur, e.g. lowering prices while the market has good faith. These can be explained by minority sellers who act contrary to the feelings in the market. You can then decide that this might be an unsustainable move of the quotes.
If the faith indicator confirms the price movement, you might assume that the move is meaningful and will go further. Also if you see faith diminishing you might assume that the move is coming to an end and the tide is going to turn.
오픈 소스 스크립트
트레이딩뷰의 진정한 정신에 따라, 이 스크립트의 작성자는 이를 오픈소스로 공개하여 트레이더들이 기능을 검토하고 검증할 수 있도록 했습니다. 작성자에게 찬사를 보냅니다! 이 코드는 무료로 사용할 수 있지만, 코드를 재게시하는 경우 하우스 룰이 적용된다는 점을 기억하세요.
면책사항
해당 정보와 게시물은 금융, 투자, 트레이딩 또는 기타 유형의 조언이나 권장 사항으로 간주되지 않으며, 트레이딩뷰에서 제공하거나 보증하는 것이 아닙니다. 자세한 내용은 이용 약관을 참조하세요.
오픈 소스 스크립트
트레이딩뷰의 진정한 정신에 따라, 이 스크립트의 작성자는 이를 오픈소스로 공개하여 트레이더들이 기능을 검토하고 검증할 수 있도록 했습니다. 작성자에게 찬사를 보냅니다! 이 코드는 무료로 사용할 수 있지만, 코드를 재게시하는 경우 하우스 룰이 적용된다는 점을 기억하세요.
면책사항
해당 정보와 게시물은 금융, 투자, 트레이딩 또는 기타 유형의 조언이나 권장 사항으로 간주되지 않으며, 트레이딩뷰에서 제공하거나 보증하는 것이 아닙니다. 자세한 내용은 이용 약관을 참조하세요.