INVITE-ONLY SCRIPT
업데이트됨 (CM|DB) Caruso Market Dashboard
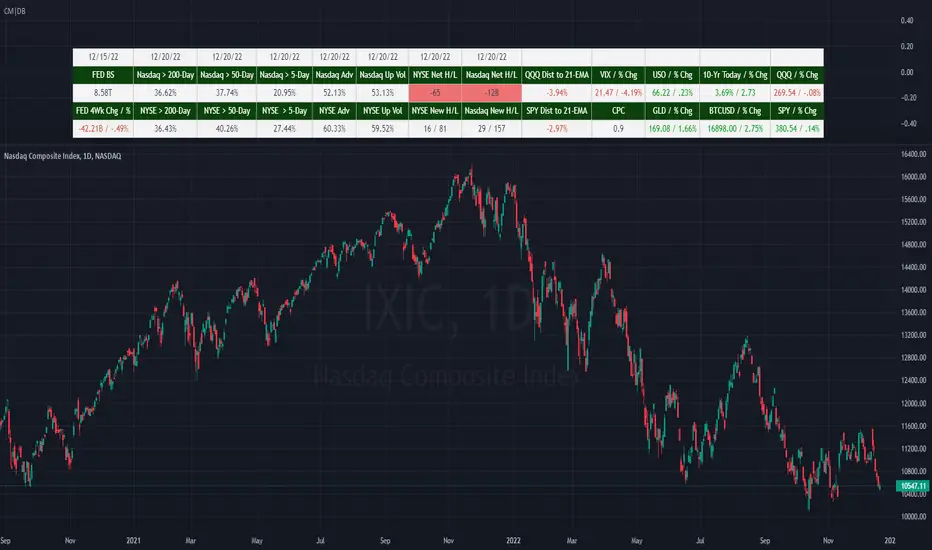
The Caruso Market Dashboard (CM|DB) provides a snapshot of key US market data, market internals (breadth), and economic statistics. It displays real-time prices of seven major markets along with daily updates of the put/call ratio and multiple breadth measurements. Lastly, it displays the Federal Reserve’s balance sheet and 4-week change of assets held to help investors keep abreast of important FED changes in policy.
Presented for both the Nasdaq and NYSE composites and updated at the end of each trading day, the market breadth section shows:
· the number of net 52-week highs and lows
· the actual number of new 52-week highs and 52-week lows.
· The percentage of volume traded on up stocks vs. total volume
· The percentage of stocks advancing vs. all stocks
· Percentage of stocks above their 5-day average
· Percentage of stocks above their 50-day average
· Percentage of stocks above their 200-day average
In addition to presenting all of this valuable information in a table, users can hide the table and plot each market and economic data point. This is very helpful when viewing trends as well as overbought and oversold levels for these data points.
릴리즈 노트
Version 2.0■ Intraday support.
■ Add option to change market data symbols.
릴리즈 노트
Bug Fix■ The SPY cell now correctly displays text green or red depending on the daily change.
■ New symbol names now display correctly if the dashboard's breadth stats are not shown
초대 전용 스크립트
이 스크립트는 작성자가 승인한 사용자만 접근할 수 있습니다. 사용하려면 요청 후 승인을 받아야 하며, 일반적으로 결제 후에 허가가 부여됩니다. 자세한 내용은 아래 작성자의 안내를 따르거나 CarusoInsights에게 직접 문의하세요.
트레이딩뷰는 스크립트의 작동 방식을 충분히 이해하고 작성자를 완전히 신뢰하지 않는 이상, 해당 스크립트에 비용을 지불하거나 사용하는 것을 권장하지 않습니다. 커뮤니티 스크립트에서 무료 오픈소스 대안을 찾아보실 수도 있습니다.
작성자 지시 사항
Get access to CarusoInsights indicators: https://www.carusoinsights.com/charting/
Get access to CarusoInsights indicators: carusoinsights.com/charting/
면책사항
해당 정보와 게시물은 금융, 투자, 트레이딩 또는 기타 유형의 조언이나 권장 사항으로 간주되지 않으며, 트레이딩뷰에서 제공하거나 보증하는 것이 아닙니다. 자세한 내용은 이용 약관을 참조하세요.