OPEN-SOURCE SCRIPT
Kapua Whenua LANDZZ1
Kapua Whenua means Earth's Clouds in Maori language, this indicator was created to show impulses and trends of the asset's price movement both up and down.
The Indicator was made based on key numbers of the golden ratio:
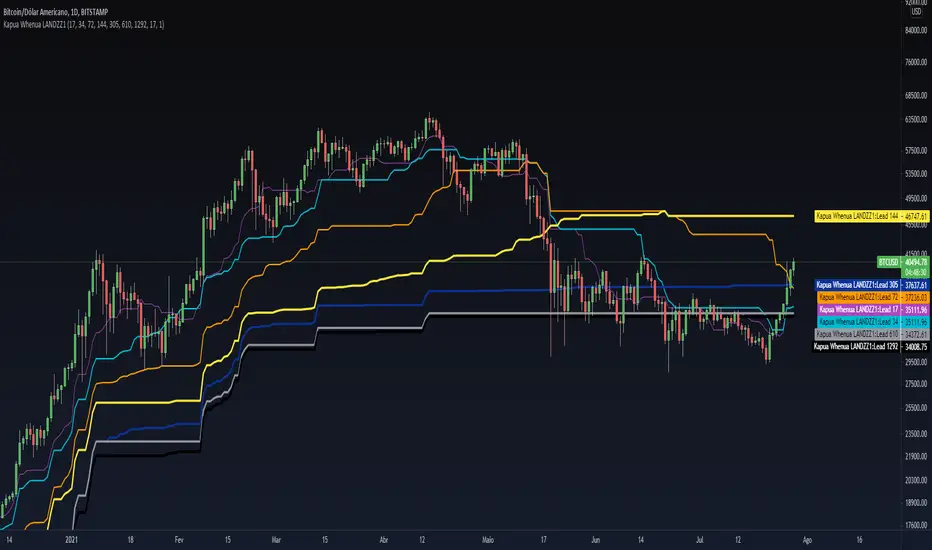
Conversion Line: Kw 17 (Purple Color)
Kw 34 - Short Period Fractal (Light Blue Color)
Kw 72 - Short/Medium Period Fractal (Orange)
Kw 144 - Medium Period Fractal (Yellow Color)
Kw 305 - Medium/Long Period Fractal (Dark Blue Color)
Kw 610 - Long Period Fractal (Grey)
Kw 1292 - Long Period Fractal+ (Black Color)
The baseline or also called the conversion line is identified by the Color Purple of value 17.
How to read the indicator:
Every time the conversion line (Purple Color 17 periods) crosses a Kw value (Kapua Whenua) it will always look for the next KW line above or below the value as support or resistance.
For example:
If we are in a bull market, and the price crosses below the KW17 conversion line it will go towards KW 34 as support, if the price breaks KW 34 it will go towards the next line below KW 34 as support.
Every time the conversion line or the price crosses a higher value of Kapua Whenua (KW) this trend will be stronger, it means, if the conversion line (KW 17) crosses above KW 305 it will indicate more strength than if it had crossed above the KW 72 or 144 for example. So to get better results trading with the trend, always observe if the conversion line and the price are below or above some Medium/Long Period KW.
Note also that, in an uptrend, it could be that all KW are below each other. In a downtrend, it could be that all KW are on top of each other. This indicates that the farther the price is from the fractals the stronger the trend is, also, when there is a narrowing of the fractals means that the price will start to go sideways. If the price is between 2 or more Fractals, it will indicate consolidation.
A really good trend is considered when the price or the Short/Medium Period Fractals are all above or below at KW 610, which is a long period fractal, meaning a strong uptrend or downtrend.
A larger KW can be at the same point as a smaller KW, however, the stronger color will be shown above the weaker one.
***Larger chart timeframes are better to see longer KW fractals that are above or below the price, if your chart timeframe doesn't show a bigger support or resistance fractal, change the chart time to another longer period**
Tip - Get used to looking at line colors as your indicators, just like moving averages. You can also take or place any fractal at any time in the configuration menu.
The Indicator was made based on key numbers of the golden ratio:
Conversion Line: Kw 17 (Purple Color)
Kw 34 - Short Period Fractal (Light Blue Color)
Kw 72 - Short/Medium Period Fractal (Orange)
Kw 144 - Medium Period Fractal (Yellow Color)
Kw 305 - Medium/Long Period Fractal (Dark Blue Color)
Kw 610 - Long Period Fractal (Grey)
Kw 1292 - Long Period Fractal+ (Black Color)
The baseline or also called the conversion line is identified by the Color Purple of value 17.
How to read the indicator:
Every time the conversion line (Purple Color 17 periods) crosses a Kw value (Kapua Whenua) it will always look for the next KW line above or below the value as support or resistance.
For example:
If we are in a bull market, and the price crosses below the KW17 conversion line it will go towards KW 34 as support, if the price breaks KW 34 it will go towards the next line below KW 34 as support.
Every time the conversion line or the price crosses a higher value of Kapua Whenua (KW) this trend will be stronger, it means, if the conversion line (KW 17) crosses above KW 305 it will indicate more strength than if it had crossed above the KW 72 or 144 for example. So to get better results trading with the trend, always observe if the conversion line and the price are below or above some Medium/Long Period KW.
Note also that, in an uptrend, it could be that all KW are below each other. In a downtrend, it could be that all KW are on top of each other. This indicates that the farther the price is from the fractals the stronger the trend is, also, when there is a narrowing of the fractals means that the price will start to go sideways. If the price is between 2 or more Fractals, it will indicate consolidation.
A really good trend is considered when the price or the Short/Medium Period Fractals are all above or below at KW 610, which is a long period fractal, meaning a strong uptrend or downtrend.
A larger KW can be at the same point as a smaller KW, however, the stronger color will be shown above the weaker one.
***Larger chart timeframes are better to see longer KW fractals that are above or below the price, if your chart timeframe doesn't show a bigger support or resistance fractal, change the chart time to another longer period**
Tip - Get used to looking at line colors as your indicators, just like moving averages. You can also take or place any fractal at any time in the configuration menu.
오픈 소스 스크립트
트레이딩뷰의 진정한 정신에 따라, 이 스크립트의 작성자는 이를 오픈소스로 공개하여 트레이더들이 기능을 검토하고 검증할 수 있도록 했습니다. 작성자에게 찬사를 보냅니다! 이 코드는 무료로 사용할 수 있지만, 코드를 재게시하는 경우 하우스 룰이 적용된다는 점을 기억하세요.
면책사항
해당 정보와 게시물은 금융, 투자, 트레이딩 또는 기타 유형의 조언이나 권장 사항으로 간주되지 않으며, 트레이딩뷰에서 제공하거나 보증하는 것이 아닙니다. 자세한 내용은 이용 약관을 참조하세요.
오픈 소스 스크립트
트레이딩뷰의 진정한 정신에 따라, 이 스크립트의 작성자는 이를 오픈소스로 공개하여 트레이더들이 기능을 검토하고 검증할 수 있도록 했습니다. 작성자에게 찬사를 보냅니다! 이 코드는 무료로 사용할 수 있지만, 코드를 재게시하는 경우 하우스 룰이 적용된다는 점을 기억하세요.
면책사항
해당 정보와 게시물은 금융, 투자, 트레이딩 또는 기타 유형의 조언이나 권장 사항으로 간주되지 않으며, 트레이딩뷰에서 제공하거나 보증하는 것이 아닙니다. 자세한 내용은 이용 약관을 참조하세요.