PROTECTED SOURCE SCRIPT
Daily Data
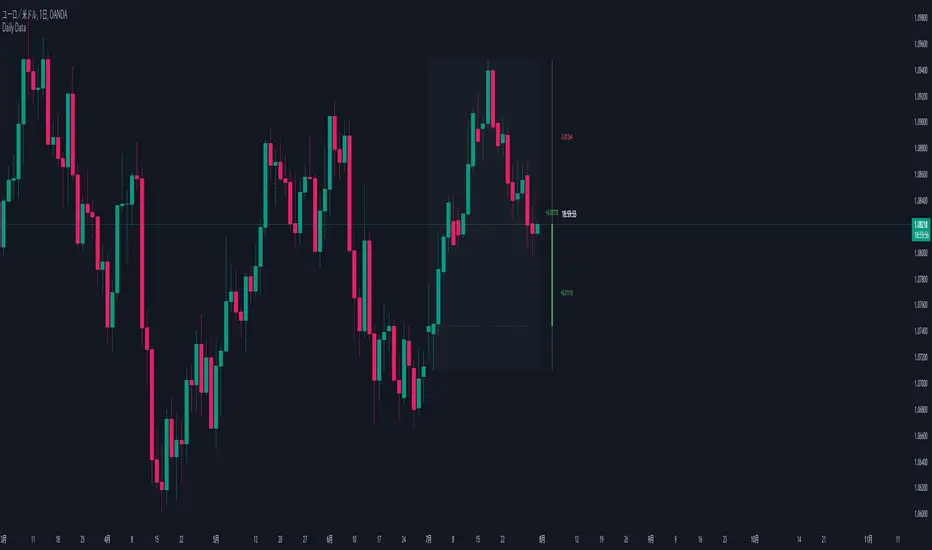
1. Purpose:
This indicator visualizes higher timeframe data on lower timeframe charts, facilitating multi-timeframe analysis. It recreates and extends the functionality of the MQL indicator of the same name in PineScript.
2. Key Features:
a. Higher Timeframe Candle Display:
- Displays monthly data by default, but users can select any timeframe.
- Customizable candle colors (bullish/bearish), wick, and body sizes.
- Adjustable offset to change display position on the chart.
b. Price Range Box:
- Shows the high and low range of the higher timeframe as a semi-transparent box.
- Customizable background color.
c. Fibonacci Levels:
- Displays 7 Fibonacci levels within the higher timeframe price range (0, 23.6%, 38.2%, 50%, 61.8%, 78.6%, 100%).
- Uses different colors for each level and shows level values as labels.
- Can be toggled on/off.
d. Information Labels:
- Remaining Time Display: Countdown to the end of the current higher timeframe candle.
- Delta Display: Shows price change from the open of the current higher timeframe.
- Distance from High/Low: Displays the difference between current price and high/low.
- Each label can be customized for visibility and color.
3. Special Features:
- Displays "MARKET IS CLOSED" when the market is not open.
- Time display format includes months, days, hours, minutes, and seconds, abbreviated as needed.
- Delta and distance values change color based on positive/negative values and are displayed with up/down arrows.
4. Customizability:
- Extensive input options allow users to fine-tune appearance and functionality.
- Individual settings for colors, sizes, offsets, and display items.
보호된 스크립트입니다
이 스크립트는 비공개 소스로 게시됩니다. 하지만 이를 자유롭게 제한 없이 사용할 수 있습니다 – 자세한 내용은 여기에서 확인하세요.
면책사항
해당 정보와 게시물은 금융, 투자, 트레이딩 또는 기타 유형의 조언이나 권장 사항으로 간주되지 않으며, 트레이딩뷰에서 제공하거나 보증하는 것이 아닙니다. 자세한 내용은 이용 약관을 참조하세요.
면책사항
해당 정보와 게시물은 금융, 투자, 트레이딩 또는 기타 유형의 조언이나 권장 사항으로 간주되지 않으며, 트레이딩뷰에서 제공하거나 보증하는 것이 아닙니다. 자세한 내용은 이용 약관을 참조하세요.