PROTECTED SOURCE SCRIPT
업데이트됨 ETHBTC Z-Score
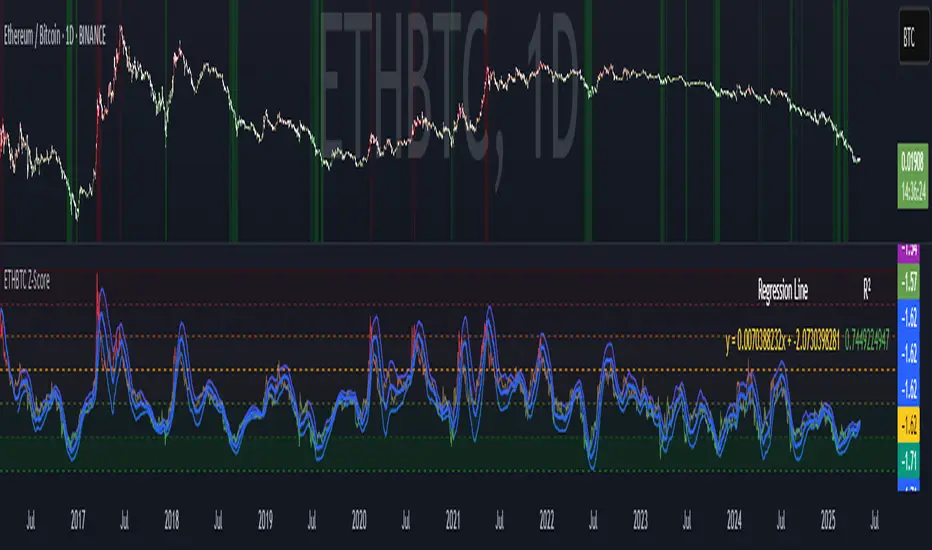
ETHBTC Z-Score Indicator
Key Features
Z-Score Calculation: Measures how far ETHBTC deviates from its mean over a user-defined period.
Linear Regression Line: Tracks the trend of the Z-score using least squares regression.
Standard Deviation Bands: Plots ±N standard deviations around the regression line to show expected Z-score range.
Dynamic Thresholds: Highlights overbought (e.g. Z > 1) and oversold (e.g. Z < -2) zones using color and background fill.
Visual & Table Display: Color-coded bars, horizontal level fills, and optional table showing regression formula and R².
Usage
Spot overbought/oversold extremes when Z-score crosses defined thresholds.
Use the regression line as a dynamic baseline and its bands as range boundaries.
Monitor R² to gauge how well the regression line fits the recent Z-score trend.
Example
Z > 1: ETHBTC may be overbought — potential caution or mean-reversion.
Z < -2: ETHBTC may be oversold — possible buying opportunity.
Z near regression line: Price is in line with recent trend.
릴리즈 노트
Updated to work on chart's timeframe보호된 스크립트입니다
이 스크립트는 비공개 소스로 게시됩니다. 하지만 이를 자유롭게 제한 없이 사용할 수 있습니다 – 자세한 내용은 여기에서 확인하세요.
면책사항
해당 정보와 게시물은 금융, 투자, 트레이딩 또는 기타 유형의 조언이나 권장 사항으로 간주되지 않으며, 트레이딩뷰에서 제공하거나 보증하는 것이 아닙니다. 자세한 내용은 이용 약관을 참조하세요.
보호된 스크립트입니다
이 스크립트는 비공개 소스로 게시됩니다. 하지만 이를 자유롭게 제한 없이 사용할 수 있습니다 – 자세한 내용은 여기에서 확인하세요.
면책사항
해당 정보와 게시물은 금융, 투자, 트레이딩 또는 기타 유형의 조언이나 권장 사항으로 간주되지 않으며, 트레이딩뷰에서 제공하거나 보증하는 것이 아닙니다. 자세한 내용은 이용 약관을 참조하세요.