OPEN-SOURCE SCRIPT
업데이트됨 ATR Multiples Plotted
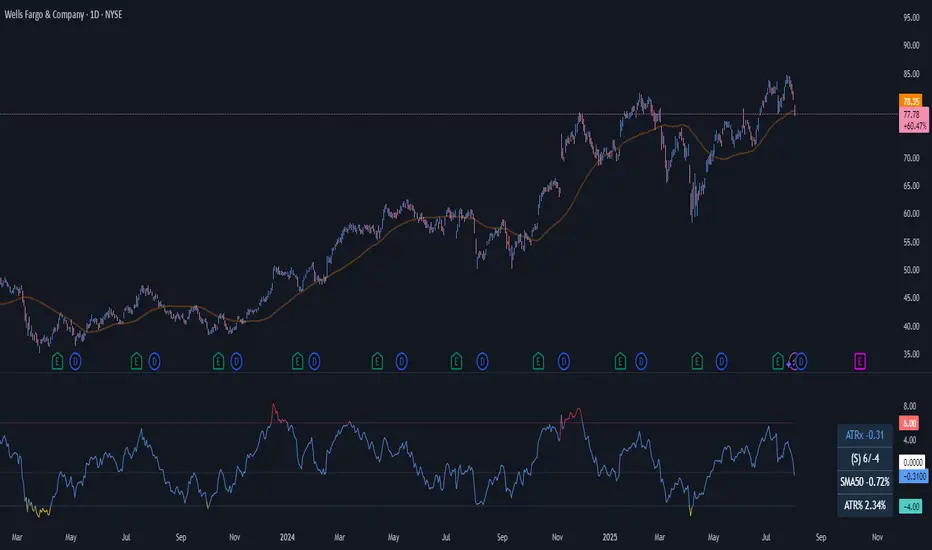
Inspired by @jeffsuntrading and @Fred6724's ATR% multiple from 50-MA.
There are no catch-all values, however a high of 6 and a low of -4 generally has been valuable to me. I tend to look at the historical highs and lows of the indicator, and adjust the Value High and Value Low accordingly to get an idea when profit-taking may be sensible.
The essence is the difference between price and the selected moving average, measured in ATRs.
릴리즈 노트
Added custom ATR Length릴리즈 노트
Added optional 0-line릴리즈 노트
Tidied and clarified some of the code.--Currently working on an 'Adaptive Mode', which will calculate and plot the upper and lower values based on the selected average's historical turning points
릴리즈 노트
Added quick reference table to show the dollar value of your chosen Value High and it's upside percentage. Comes in handy when scanning or evaluating Pre/Post-Market moves. See ATRx6 value and AMZN pre-market value of ~$170 on 02/02/2024 for example.
릴리즈 노트
Chart릴리즈 노트
Added option to allow percentage based calculations, which is how Jeff Sun's indicator is calculated. Some changes and clarification to the table, see the tooltips for guidance.
릴리즈 노트
Chart update릴리즈 노트
Fixed typos in table릴리즈 노트
Updated to Pine v6릴리즈 노트
Added Dynamic Mode, which you can enable from the indicator settings. It calculates the upper and lower thresholds based on the lookback value.By default, the lookback is set to 504 bars (roughly 2 years on a daily chart), and it uses the 95th and 5th percentiles. You can change both in the settings. If there’s not enough data to calculate them (like with recent IPOs), it’ll fall back to static values until the full lookback becomes available.
I haven’t nailed down the ideal lookback and percentile settings yet, so the defaults might not be super useful straight away.
Nothing has changed for the static mode. For price-based signals, I find 6 and -4 thresholds work best most of the time. For percentage-based, 9 and -3 seem reliable.
릴리즈 노트
Minor change to info in table릴리즈 노트
Updated chart오픈 소스 스크립트
트레이딩뷰의 진정한 정신에 따라, 이 스크립트의 작성자는 이를 오픈소스로 공개하여 트레이더들이 기능을 검토하고 검증할 수 있도록 했습니다. 작성자에게 찬사를 보냅니다! 이 코드는 무료로 사용할 수 있지만, 코드를 재게시하는 경우 하우스 룰이 적용된다는 점을 기억하세요.
면책사항
해당 정보와 게시물은 금융, 투자, 트레이딩 또는 기타 유형의 조언이나 권장 사항으로 간주되지 않으며, 트레이딩뷰에서 제공하거나 보증하는 것이 아닙니다. 자세한 내용은 이용 약관을 참조하세요.
오픈 소스 스크립트
트레이딩뷰의 진정한 정신에 따라, 이 스크립트의 작성자는 이를 오픈소스로 공개하여 트레이더들이 기능을 검토하고 검증할 수 있도록 했습니다. 작성자에게 찬사를 보냅니다! 이 코드는 무료로 사용할 수 있지만, 코드를 재게시하는 경우 하우스 룰이 적용된다는 점을 기억하세요.
면책사항
해당 정보와 게시물은 금융, 투자, 트레이딩 또는 기타 유형의 조언이나 권장 사항으로 간주되지 않으며, 트레이딩뷰에서 제공하거나 보증하는 것이 아닙니다. 자세한 내용은 이용 약관을 참조하세요.