PROTECTED SOURCE SCRIPT
Volume Bubbles Delta Coloring Pro V1.0
OVERVIEW
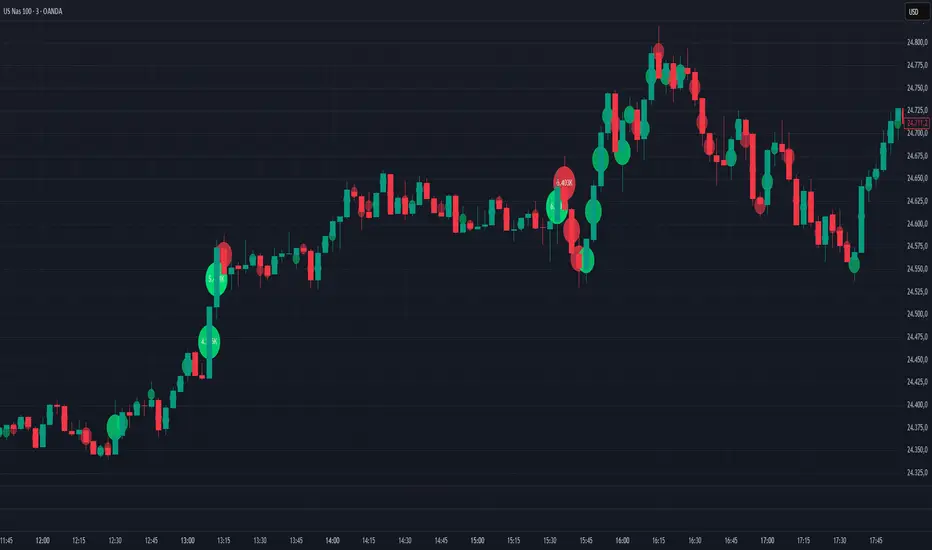
Bubbles Volume — Delta Pro extends the Classic concept with directional volume coloring and practical filters. It visualizes where volume concentrates inside each candle and which side (buyers or sellers) dominated. Ideal for intraday traders who want to see both intensity and direction of market activity.
HOW IT WORKS
Each bubble represents the candle’s volume normalized by volatility. Bubble size reflects relative volume; color reflects directional bias:
• Green = Buyer dominance (close > open)
• Red = Seller dominance (close < open)
• Yellow = Neutral (balanced candle)
A built-in delta proxy ((close – open) / range × volume) estimates directional strength — not true bid/ask delta, but a reliable approximation for chart volume.
FEATURES
• Delta coloring with adjustable Buy/Sell/Neutral colors
• Volume and delta thresholds to filter weak signals
• Session filter (e.g., 09:30–16:00) and lookback limit for speed
• Bubble position modes: HL2, Close, Body Mid, or High/Low by Delta
• Optional labels/lines for extreme volume
• Alerts for high-volume or strong delta spikes
USE CASES
Identify areas where aggressive buyers or sellers appeared, confirm breakouts with volume direction, or filter noise during low-activity periods. Combine with structure or VWAP for context.
NOTES
• Uses candle-based approximation, not orderflow.
• Visualization tool only; not a standalone signal.
• Original concept by BigBeluga, enhanced with delta logic and performance filters.
Licensed under CC BY-NC-SA 4.0.
보호된 스크립트입니다
이 스크립트는 비공개 소스로 게시됩니다. 하지만 이를 자유롭게 제한 없이 사용할 수 있습니다 – 자세한 내용은 여기에서 확인하세요.
면책사항
해당 정보와 게시물은 금융, 투자, 트레이딩 또는 기타 유형의 조언이나 권장 사항으로 간주되지 않으며, 트레이딩뷰에서 제공하거나 보증하는 것이 아닙니다. 자세한 내용은 이용 약관을 참조하세요.
보호된 스크립트입니다
이 스크립트는 비공개 소스로 게시됩니다. 하지만 이를 자유롭게 제한 없이 사용할 수 있습니다 – 자세한 내용은 여기에서 확인하세요.
면책사항
해당 정보와 게시물은 금융, 투자, 트레이딩 또는 기타 유형의 조언이나 권장 사항으로 간주되지 않으며, 트레이딩뷰에서 제공하거나 보증하는 것이 아닙니다. 자세한 내용은 이용 약관을 참조하세요.