OPEN-SOURCE SCRIPT
업데이트됨 Falcon Liquidity Grab Strategy
How to Use This Script for Commodities and Indices
Best Timeframes: Start with 15-minute charts but test on higher timeframes like 1 hour for indices.
Risk Settings: Adjust the stop_loss_points and take_profit_multiplier to match the volatility of the chosen instrument.
Best Timeframes: Start with 15-minute charts but test on higher timeframes like 1 hour for indices.
Risk Settings: Adjust the stop_loss_points and take_profit_multiplier to match the volatility of the chosen instrument.
릴리즈 노트
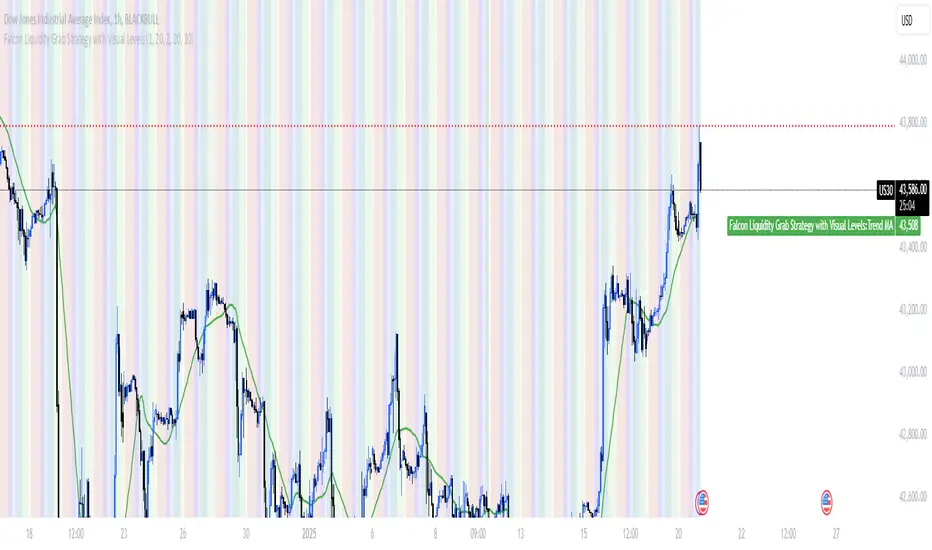
Explanation of AdditionsTake-Profit Levels (Green Dotted Lines):
A green dotted line is drawn at the take-profit level for both long and short trades.
These lines adjust dynamically based on the calculated take-profit level.
Stop-Loss Levels (Red Dotted Lines):
A red dotted line is drawn at the stop-loss level for both long and short trades.
These lines adjust dynamically based on the calculated stop-loss level.
Entry Level Block:
A solid blue line is drawn at the entry price to visually highlight where the trade begins.
Session Background Colors:
Session backgrounds remain the same to help contextualize the trades.
오픈 소스 스크립트
트레이딩뷰의 진정한 정신에 따라, 이 스크립트의 작성자는 이를 오픈소스로 공개하여 트레이더들이 기능을 검토하고 검증할 수 있도록 했습니다. 작성자에게 찬사를 보냅니다! 이 코드는 무료로 사용할 수 있지만, 코드를 재게시하는 경우 하우스 룰이 적용된다는 점을 기억하세요.
면책사항
해당 정보와 게시물은 금융, 투자, 트레이딩 또는 기타 유형의 조언이나 권장 사항으로 간주되지 않으며, 트레이딩뷰에서 제공하거나 보증하는 것이 아닙니다. 자세한 내용은 이용 약관을 참조하세요.
오픈 소스 스크립트
트레이딩뷰의 진정한 정신에 따라, 이 스크립트의 작성자는 이를 오픈소스로 공개하여 트레이더들이 기능을 검토하고 검증할 수 있도록 했습니다. 작성자에게 찬사를 보냅니다! 이 코드는 무료로 사용할 수 있지만, 코드를 재게시하는 경우 하우스 룰이 적용된다는 점을 기억하세요.
면책사항
해당 정보와 게시물은 금융, 투자, 트레이딩 또는 기타 유형의 조언이나 권장 사항으로 간주되지 않으며, 트레이딩뷰에서 제공하거나 보증하는 것이 아닙니다. 자세한 내용은 이용 약관을 참조하세요.