PROTECTED SOURCE SCRIPT
Turtle Soup Pivots | InvrsROBINHOOD
Turtle Soup Pivots Indicator | InvrsROBINHOOD
Overview
The "Turtle Soup Pivots" indicator is a powerful tool designed to identify a specific three-point price action pattern that often precedes market reversals. By marking a sequence of key events on your chart, it helps you visualize potential "stop hunts" or "false moves" where the market may be poised to reverse direction.
How It Works
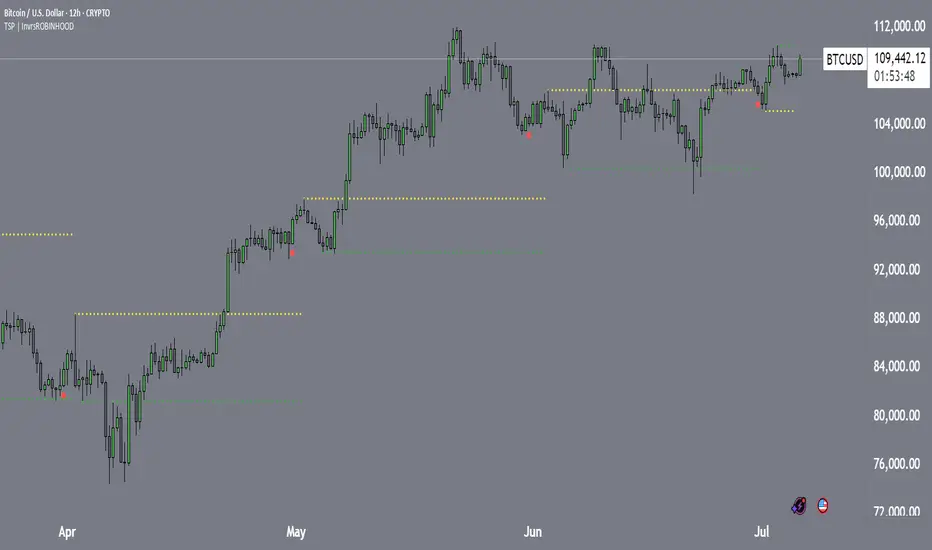
The indicator automatically identifies and plots three key points in a sequence:
The Starting Candle (Red Dot): This marks the beginning of a new analysis period. You can configure this to be the first candle of the month, week, day, or a specific trading session (like Asia, London, or New York). This candle establishes the baseline for the pattern.
The False Move Pivot (Yellow Dot): This is the first significant pivot high or pivot low that forms after the Starting Candle. This move often represents an initial, and potentially misleading, push in one direction, frequently triggering stop-loss orders above or below a recent range.
The Turtle Soup Pivot (Green Dot): This is the crucial third point. It is the first pivot that forms in the opposite direction of the False Move pivot. For a reversal to be considered valid, this pivot must break the level of the False Move pivot, often by a user-defined percentage. The appearance of this green dot signals that the initial "false move" has been rejected and that the market may be preparing to move decisively in the opposite direction.
The required sequence is always: Red Dot → Yellow Dot → Green Dot.
How to Use This Indicator in Your Trading
The core idea behind this indicator is to trade against the "false move." It helps you identify moments where the market has shown its hand, and a reversal is likely.
Bullish Reversal Signal (Potential Buy):
• A Starting Candle (red dot) appears.
• The market creates a False Move Pivot Low (yellow dot).
• The indicator then plots a Turtle Soup Pivot High (green dot), which breaks below the low of the False Move pivot.
Interpretation: This sequence suggests that an initial move to the upside was a "stop hunt" or a false move. The subsequent break to the downside indicates that buyers may step in, presenting a potential entry point for a long position.
Bearish Reversal Signal (Potential Sell):
• A Starting Candle (red dot) appears.
• The market creates a False Move Pivot Low (yellow dot).
• The indicator then plots a Turtle Soup Pivot High (green dot), which breaks below the low of the False Move pivot.
Interpretation: This sequence suggests that an initial rally was a false move. The subsequent break to the upside indicates that sellers are stepping in, presenting a potential entry point for a short position.
Key Features & Customization
To tailor the indicator to your specific strategy and market, you can adjust the following settings:
• Starting Point: Choose what constitutes the start of a new period (Month, Week, Day, or Session).
• Session Selection: Enable or disable individual trading sessions (Asia, London AM/PM, NY AM/PM) to act as starting points.
• Pivot Sensitivity: Define how many candles are required on the left and right to form a valid pivot, allowing you to filter out minor fluctuations.
• Reversal Threshold: Set a minimum percentage that the Turtle Soup pivot must break the False Move pivot by, adding an extra layer of confirmation to the signal.
• Visuals: Customize the color and size of each dot to match your chart's theme.
By combining the signals from this indicator with your own analysis of market structure, support/resistance levels, and other confluences, you can develop a robust strategy for identifying and trading high-probability reversals.
Overview
The "Turtle Soup Pivots" indicator is a powerful tool designed to identify a specific three-point price action pattern that often precedes market reversals. By marking a sequence of key events on your chart, it helps you visualize potential "stop hunts" or "false moves" where the market may be poised to reverse direction.
How It Works
The indicator automatically identifies and plots three key points in a sequence:
The Starting Candle (Red Dot): This marks the beginning of a new analysis period. You can configure this to be the first candle of the month, week, day, or a specific trading session (like Asia, London, or New York). This candle establishes the baseline for the pattern.
The False Move Pivot (Yellow Dot): This is the first significant pivot high or pivot low that forms after the Starting Candle. This move often represents an initial, and potentially misleading, push in one direction, frequently triggering stop-loss orders above or below a recent range.
The Turtle Soup Pivot (Green Dot): This is the crucial third point. It is the first pivot that forms in the opposite direction of the False Move pivot. For a reversal to be considered valid, this pivot must break the level of the False Move pivot, often by a user-defined percentage. The appearance of this green dot signals that the initial "false move" has been rejected and that the market may be preparing to move decisively in the opposite direction.
The required sequence is always: Red Dot → Yellow Dot → Green Dot.
How to Use This Indicator in Your Trading
The core idea behind this indicator is to trade against the "false move." It helps you identify moments where the market has shown its hand, and a reversal is likely.
Bullish Reversal Signal (Potential Buy):
• A Starting Candle (red dot) appears.
• The market creates a False Move Pivot Low (yellow dot).
• The indicator then plots a Turtle Soup Pivot High (green dot), which breaks below the low of the False Move pivot.
Interpretation: This sequence suggests that an initial move to the upside was a "stop hunt" or a false move. The subsequent break to the downside indicates that buyers may step in, presenting a potential entry point for a long position.
Bearish Reversal Signal (Potential Sell):
• A Starting Candle (red dot) appears.
• The market creates a False Move Pivot Low (yellow dot).
• The indicator then plots a Turtle Soup Pivot High (green dot), which breaks below the low of the False Move pivot.
Interpretation: This sequence suggests that an initial rally was a false move. The subsequent break to the upside indicates that sellers are stepping in, presenting a potential entry point for a short position.
Key Features & Customization
To tailor the indicator to your specific strategy and market, you can adjust the following settings:
• Starting Point: Choose what constitutes the start of a new period (Month, Week, Day, or Session).
• Session Selection: Enable or disable individual trading sessions (Asia, London AM/PM, NY AM/PM) to act as starting points.
• Pivot Sensitivity: Define how many candles are required on the left and right to form a valid pivot, allowing you to filter out minor fluctuations.
• Reversal Threshold: Set a minimum percentage that the Turtle Soup pivot must break the False Move pivot by, adding an extra layer of confirmation to the signal.
• Visuals: Customize the color and size of each dot to match your chart's theme.
By combining the signals from this indicator with your own analysis of market structure, support/resistance levels, and other confluences, you can develop a robust strategy for identifying and trading high-probability reversals.
보호된 스크립트입니다
이 스크립트는 비공개 소스로 게시됩니다. 하지만 이를 자유롭게 제한 없이 사용할 수 있습니다 – 자세한 내용은 여기에서 확인하세요.
면책사항
해당 정보와 게시물은 금융, 투자, 트레이딩 또는 기타 유형의 조언이나 권장 사항으로 간주되지 않으며, 트레이딩뷰에서 제공하거나 보증하는 것이 아닙니다. 자세한 내용은 이용 약관을 참조하세요.
보호된 스크립트입니다
이 스크립트는 비공개 소스로 게시됩니다. 하지만 이를 자유롭게 제한 없이 사용할 수 있습니다 – 자세한 내용은 여기에서 확인하세요.
면책사항
해당 정보와 게시물은 금융, 투자, 트레이딩 또는 기타 유형의 조언이나 권장 사항으로 간주되지 않으며, 트레이딩뷰에서 제공하거나 보증하는 것이 아닙니다. 자세한 내용은 이용 약관을 참조하세요.