OPEN-SOURCE SCRIPT
업데이트됨 HTF FVG D/W/M 25%/50%/75% [MK]
Do you use HTF FVG (fair value gaps) in your trading strategy? Do you monitor price on the 25%/50%/75% levels within the FVG on a lower timeframe?
This script will allow the user to display either Daily, Weekly or Monthly FVGs on a lower timeframe chart. The script will then also show the 25%/50%/75% levels within the HTF FVG so traders can see how price reacts in the FVG.
For example, a Weekly FVG may be chosen by the trader as a possible reversal point, or somewhere to add to an existing position. The trader might want to see the FVG almost fully filled, then watch price climb up/down out of the Weekly FVG
before taking the trade.
Previously traders would draw the FVG to the chart, then use maybe the tradingview fib tool to display the 25%/50%/75% levels. The problem with this is that its easy to accidently move the fib while dragging the chart around.
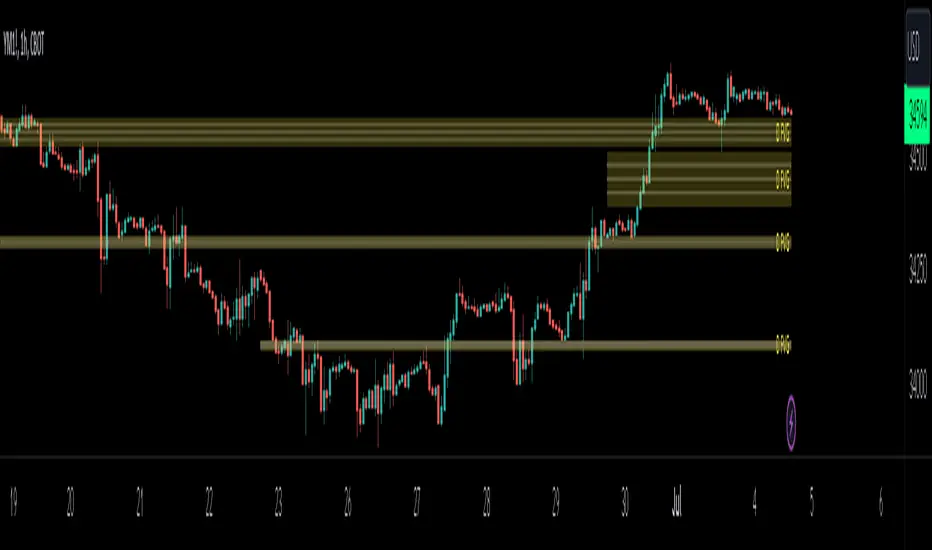
Chart below shows example of price almost filling a D FVG, then using the 25%/50%/75% levels as it climbs out of the FVG and reverses to the upside.

This script will allow the user to display either Daily, Weekly or Monthly FVGs on a lower timeframe chart. The script will then also show the 25%/50%/75% levels within the HTF FVG so traders can see how price reacts in the FVG.
For example, a Weekly FVG may be chosen by the trader as a possible reversal point, or somewhere to add to an existing position. The trader might want to see the FVG almost fully filled, then watch price climb up/down out of the Weekly FVG
before taking the trade.
Previously traders would draw the FVG to the chart, then use maybe the tradingview fib tool to display the 25%/50%/75% levels. The problem with this is that its easy to accidently move the fib while dragging the chart around.
Chart below shows example of price almost filling a D FVG, then using the 25%/50%/75% levels as it climbs out of the FVG and reverses to the upside.
릴리즈 노트
added option to show FVG for any timeframe오픈 소스 스크립트
트레이딩뷰의 진정한 정신에 따라, 이 스크립트의 작성자는 이를 오픈소스로 공개하여 트레이더들이 기능을 검토하고 검증할 수 있도록 했습니다. 작성자에게 찬사를 보냅니다! 이 코드는 무료로 사용할 수 있지만, 코드를 재게시하는 경우 하우스 룰이 적용된다는 점을 기억하세요.
면책사항
해당 정보와 게시물은 금융, 투자, 트레이딩 또는 기타 유형의 조언이나 권장 사항으로 간주되지 않으며, 트레이딩뷰에서 제공하거나 보증하는 것이 아닙니다. 자세한 내용은 이용 약관을 참조하세요.
오픈 소스 스크립트
트레이딩뷰의 진정한 정신에 따라, 이 스크립트의 작성자는 이를 오픈소스로 공개하여 트레이더들이 기능을 검토하고 검증할 수 있도록 했습니다. 작성자에게 찬사를 보냅니다! 이 코드는 무료로 사용할 수 있지만, 코드를 재게시하는 경우 하우스 룰이 적용된다는 점을 기억하세요.
면책사항
해당 정보와 게시물은 금융, 투자, 트레이딩 또는 기타 유형의 조언이나 권장 사항으로 간주되지 않으며, 트레이딩뷰에서 제공하거나 보증하는 것이 아닙니다. 자세한 내용은 이용 약관을 참조하세요.