OPEN-SOURCE SCRIPT
업데이트됨 Blood Moons
Blood Moon Dates
Description:
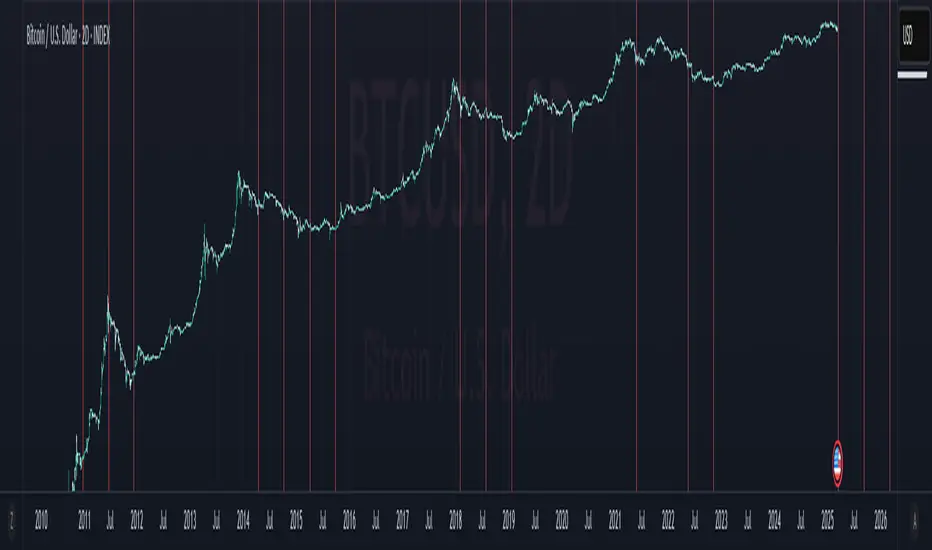
This indicator overlays vertical lines on your chart to mark the dates of total lunar eclipses (commonly known as "Blood Moons") from December 2010 to May 2040. Designed with cryptocurrency traders in mind, it’s perfect for analyzing potential correlations between these celestial events and price movements. The lines are drawn on the first bar and extend across the chart, making it easy to spot these dates on any timeframe.
Features:
Plots vertical lines for 19 Blood Moon events (2010–2040).
Customizable line color, style (solid, dotted, dashed), and width.
Option to toggle lines on/off for a cleaner chart.
Lines extend both ways for maximum visibility across your chart.
Settings:
Show Lines: Enable or disable the lines (default: enabled).
Line Color: Choose your preferred color (default: red).
Line Style: Select solid, dotted, or dashed (default: dotted).
Line Width: Adjust thickness from 1 to 5 (default: 2).
Usage:
Add this indicator to your chart to visualize Blood Moon dates alongside price action. Customize the appearance to suit your analysis style. Note: Lines are plotted based on timestamps and extend across the chart, so they’re best viewed on daily or higher timeframes for clarity.
Disclaimer:
This is an educational tool and not financial advice. Past performance does not guarantee future results. Use at your own risk.
Description:
This indicator overlays vertical lines on your chart to mark the dates of total lunar eclipses (commonly known as "Blood Moons") from December 2010 to May 2040. Designed with cryptocurrency traders in mind, it’s perfect for analyzing potential correlations between these celestial events and price movements. The lines are drawn on the first bar and extend across the chart, making it easy to spot these dates on any timeframe.
Features:
Plots vertical lines for 19 Blood Moon events (2010–2040).
Customizable line color, style (solid, dotted, dashed), and width.
Option to toggle lines on/off for a cleaner chart.
Lines extend both ways for maximum visibility across your chart.
Settings:
Show Lines: Enable or disable the lines (default: enabled).
Line Color: Choose your preferred color (default: red).
Line Style: Select solid, dotted, or dashed (default: dotted).
Line Width: Adjust thickness from 1 to 5 (default: 2).
Usage:
Add this indicator to your chart to visualize Blood Moon dates alongside price action. Customize the appearance to suit your analysis style. Note: Lines are plotted based on timestamps and extend across the chart, so they’re best viewed on daily or higher timeframes for clarity.
Disclaimer:
This is an educational tool and not financial advice. Past performance does not guarantee future results. Use at your own risk.
릴리즈 노트
quality of life with auto scaling issueswould prefer vertical lines but pinescript is too picky with those
opting for shapes instead
릴리즈 노트
script name fix from BM Balls to Blood Moons릴리즈 노트
fixed bugwill have to check in a couple days whether that blood moon date prints a shape
릴리즈 노트
updating default color/transp릴리즈 노트
reverting to near original, pinescript sucks btw릴리즈 노트
updated future dates오픈 소스 스크립트
트레이딩뷰의 진정한 정신에 따라, 이 스크립트의 작성자는 이를 오픈소스로 공개하여 트레이더들이 기능을 검토하고 검증할 수 있도록 했습니다. 작성자에게 찬사를 보냅니다! 이 코드는 무료로 사용할 수 있지만, 코드를 재게시하는 경우 하우스 룰이 적용된다는 점을 기억하세요.
면책사항
해당 정보와 게시물은 금융, 투자, 트레이딩 또는 기타 유형의 조언이나 권장 사항으로 간주되지 않으며, 트레이딩뷰에서 제공하거나 보증하는 것이 아닙니다. 자세한 내용은 이용 약관을 참조하세요.
오픈 소스 스크립트
트레이딩뷰의 진정한 정신에 따라, 이 스크립트의 작성자는 이를 오픈소스로 공개하여 트레이더들이 기능을 검토하고 검증할 수 있도록 했습니다. 작성자에게 찬사를 보냅니다! 이 코드는 무료로 사용할 수 있지만, 코드를 재게시하는 경우 하우스 룰이 적용된다는 점을 기억하세요.
면책사항
해당 정보와 게시물은 금융, 투자, 트레이딩 또는 기타 유형의 조언이나 권장 사항으로 간주되지 않으며, 트레이딩뷰에서 제공하거나 보증하는 것이 아닙니다. 자세한 내용은 이용 약관을 참조하세요.