OPEN-SOURCE SCRIPT
Enhanced Price Z-Score Oscillator
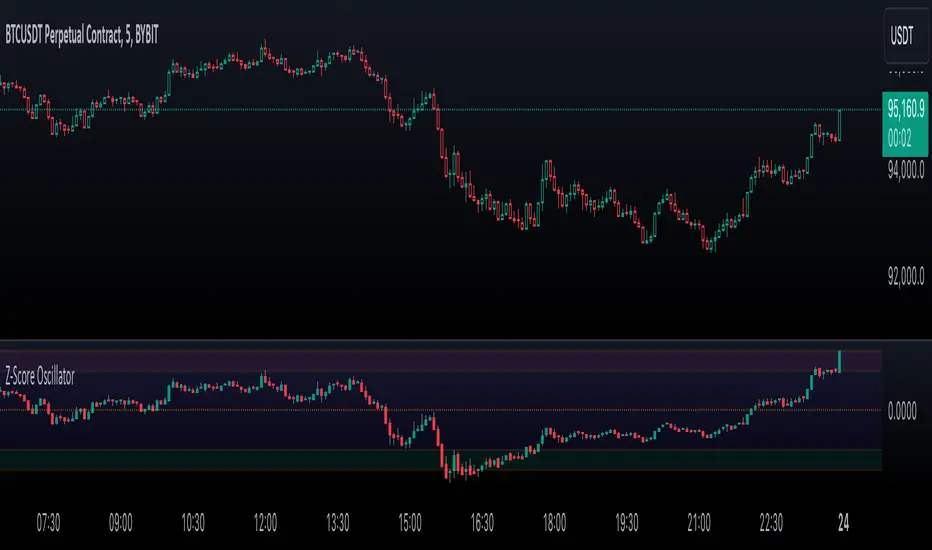
The Enhanced Price Z-Score Oscillator by tkarolak is a powerful tool that transforms raw price data into an easy-to-understand statistical visualization using Z-Score-derived candlesticks. Simply put, it shows how far prices stray from their average in terms of standard deviations (Z-Scores), helping traders identify when prices are unusually high (overbought) or unusually low (oversold).
The indicator’s default feature displays Z-Score Candlesticks, where each candle reflects the statistical “distance” of the open, high, low, and close prices from their average. This creates a visual map of market extremes and potential reversal points. For added flexibility, you can also switch to Z-Score line plots based on either Close prices or OHLC4 averages.
With clear threshold lines (±2σ and ±3σ) marking moderate and extreme price deviations, and color-coded zones to highlight overbought and oversold areas, the oscillator simplifies complex statistical concepts into actionable trading insights.
오픈 소스 스크립트
트레이딩뷰의 진정한 정신에 따라, 이 스크립트의 작성자는 이를 오픈소스로 공개하여 트레이더들이 기능을 검토하고 검증할 수 있도록 했습니다. 작성자에게 찬사를 보냅니다! 이 코드는 무료로 사용할 수 있지만, 코드를 재게시하는 경우 하우스 룰이 적용된다는 점을 기억하세요.
면책사항
해당 정보와 게시물은 금융, 투자, 트레이딩 또는 기타 유형의 조언이나 권장 사항으로 간주되지 않으며, 트레이딩뷰에서 제공하거나 보증하는 것이 아닙니다. 자세한 내용은 이용 약관을 참조하세요.
오픈 소스 스크립트
트레이딩뷰의 진정한 정신에 따라, 이 스크립트의 작성자는 이를 오픈소스로 공개하여 트레이더들이 기능을 검토하고 검증할 수 있도록 했습니다. 작성자에게 찬사를 보냅니다! 이 코드는 무료로 사용할 수 있지만, 코드를 재게시하는 경우 하우스 룰이 적용된다는 점을 기억하세요.
면책사항
해당 정보와 게시물은 금융, 투자, 트레이딩 또는 기타 유형의 조언이나 권장 사항으로 간주되지 않으며, 트레이딩뷰에서 제공하거나 보증하는 것이 아닙니다. 자세한 내용은 이용 약관을 참조하세요.