OPEN-SOURCE SCRIPT
업데이트됨 Stochastic RSI Heat Candles Overlay
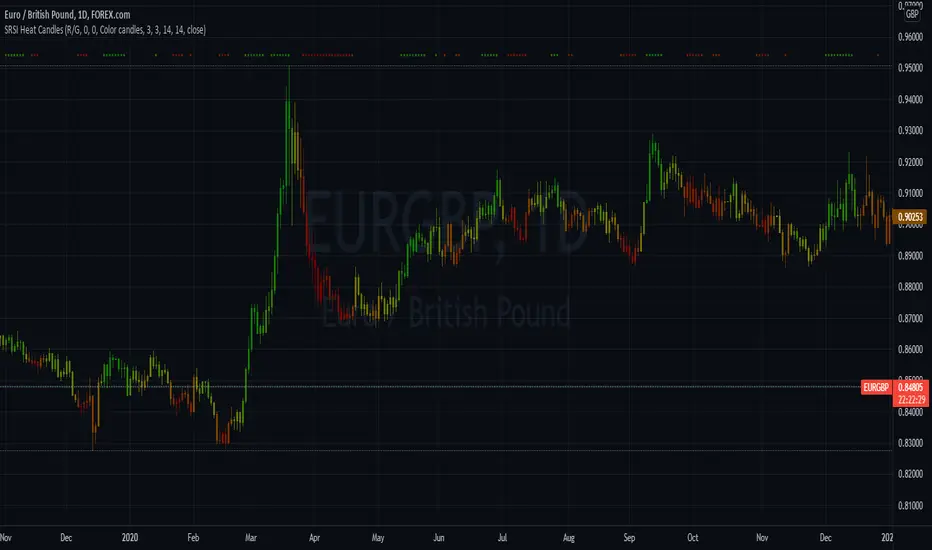
This script is based on the Stochastic RSI indicator.
Candles are dynamically colored with a customizable RGB shading directly generated from the average Stochastic RSI current value.
By default, colors represent the following status -> green is overgought & red is oversold.
Options:
Examples:


Notes:
Candles are dynamically colored with a customizable RGB shading directly generated from the average Stochastic RSI current value.
By default, colors represent the following status -> green is overgought & red is oversold.
Options:
- Shading colors: Choose between Red/Green, Green/Blue, and Blue/Red shadings to represent the SRSI heat.
- Invert colors: Switch colors of the selected shading.
- Third color: Select a value from 0 to 255 for the third color which does not vary.
- Transparency: Select the transparency value.
- Overlay style : Choose to color the whole candle, or only borders and wick.
- Show candle side: If you choose to fully fill candles with the SRSI heat color , enable this option to plot shapes representing the candles directions.
- Candle marks colors: Select bull and bear colors for direction shapes.
- Overbought and Oversold situations are also represented by colored shapes at the top of the chart.
- Standards Stochastic RSI parameters.
Examples:
Notes:
- Do not forget to bring the script to the front of your chart to avoid being covered by default candles.
- Next improvements would probably be a better coloring algorithm, however, do not hesitate to suggest any modifications in comments.
- Initially, I shared a Stochastic RSI Heat Bollinger Bands indicator which gave me the idea to develop this one, you can find it on my profile.
릴리즈 노트
Useless lines removed오픈 소스 스크립트
트레이딩뷰의 진정한 정신에 따라, 이 스크립트의 작성자는 이를 오픈소스로 공개하여 트레이더들이 기능을 검토하고 검증할 수 있도록 했습니다. 작성자에게 찬사를 보냅니다! 이 코드는 무료로 사용할 수 있지만, 코드를 재게시하는 경우 하우스 룰이 적용된다는 점을 기억하세요.
면책사항
해당 정보와 게시물은 금융, 투자, 트레이딩 또는 기타 유형의 조언이나 권장 사항으로 간주되지 않으며, 트레이딩뷰에서 제공하거나 보증하는 것이 아닙니다. 자세한 내용은 이용 약관을 참조하세요.
오픈 소스 스크립트
트레이딩뷰의 진정한 정신에 따라, 이 스크립트의 작성자는 이를 오픈소스로 공개하여 트레이더들이 기능을 검토하고 검증할 수 있도록 했습니다. 작성자에게 찬사를 보냅니다! 이 코드는 무료로 사용할 수 있지만, 코드를 재게시하는 경우 하우스 룰이 적용된다는 점을 기억하세요.
면책사항
해당 정보와 게시물은 금융, 투자, 트레이딩 또는 기타 유형의 조언이나 권장 사항으로 간주되지 않으며, 트레이딩뷰에서 제공하거나 보증하는 것이 아닙니다. 자세한 내용은 이용 약관을 참조하세요.