OPEN-SOURCE SCRIPT
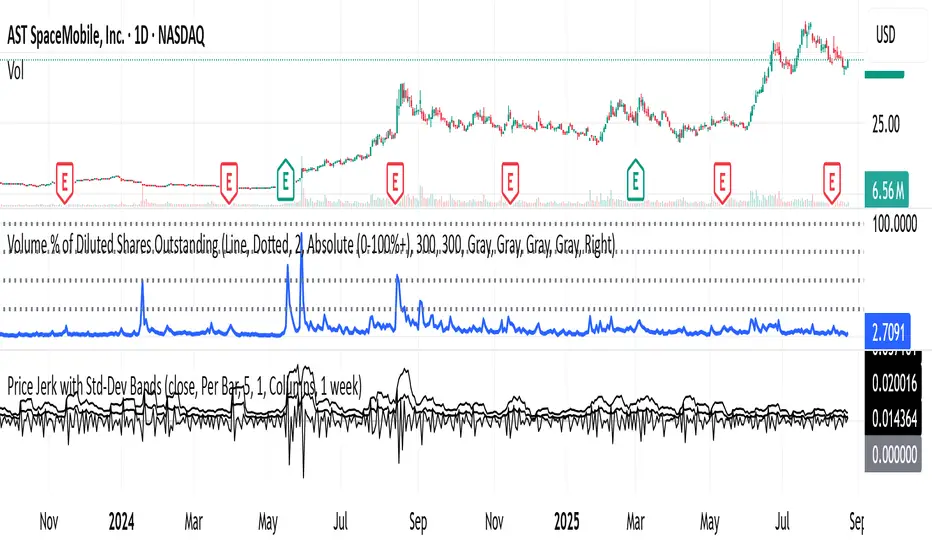
Shock Detector: Price Jerk with Std-Dev Bands
Detect sudden shocks in market behaviour
This indicator measures the jerk of price – the third derivative of price with respect to time (rate of change of acceleration). It highlights sudden accelerations and decelerations in price movement that are often invisible with standard momentum or volatility indicators.
Per-bar or time-scaled derivatives (choose whether calculations are based on bars or actual seconds).
Features
Log-price option for more stable readings across different price levels.
Optional smoothing with EMA to reduce noise.
Line or column view for flexible visualization.
Standard deviation bands (±1σ and ±2σ), centered either on zero or the rolling mean.
Auto window selection (1 day to 4 weeks), adaptive to chart timeframe.
Color-coded jerk: green for positive, red for negative.
Optional filled bands for easy visual context of normal vs. extreme jerk moves.
How to Use
Use jerk to identify sudden shifts in market dynamics, where price movement is not just changing direction but changing its acceleration.
Bands help highlight when jerk values are statistically unusual compared to recent history.
Combine with trend or momentum indicators for potential early warning of breakouts, reversals, or exhaustion.
Why it’s useful
Most indicators measure price, velocity (returns), or acceleration (momentum). This goes one step further to look at jerk, giving you a tool to spot “shock” movements in the market. By framing jerk within standard deviation bands, it’s easy to see whether current moves are ordinary or exceptional.
Developed with the assistance of ChatGPT (OpenAI).
오픈 소스 스크립트
트레이딩뷰의 진정한 정신에 따라, 이 스크립트의 작성자는 이를 오픈소스로 공개하여 트레이더들이 기능을 검토하고 검증할 수 있도록 했습니다. 작성자에게 찬사를 보냅니다! 이 코드는 무료로 사용할 수 있지만, 코드를 재게시하는 경우 하우스 룰이 적용된다는 점을 기억하세요.
면책사항
해당 정보와 게시물은 금융, 투자, 트레이딩 또는 기타 유형의 조언이나 권장 사항으로 간주되지 않으며, 트레이딩뷰에서 제공하거나 보증하는 것이 아닙니다. 자세한 내용은 이용 약관을 참조하세요.
오픈 소스 스크립트
트레이딩뷰의 진정한 정신에 따라, 이 스크립트의 작성자는 이를 오픈소스로 공개하여 트레이더들이 기능을 검토하고 검증할 수 있도록 했습니다. 작성자에게 찬사를 보냅니다! 이 코드는 무료로 사용할 수 있지만, 코드를 재게시하는 경우 하우스 룰이 적용된다는 점을 기억하세요.
면책사항
해당 정보와 게시물은 금융, 투자, 트레이딩 또는 기타 유형의 조언이나 권장 사항으로 간주되지 않으며, 트레이딩뷰에서 제공하거나 보증하는 것이 아닙니다. 자세한 내용은 이용 약관을 참조하세요.