PROTECTED SOURCE SCRIPT
업데이트됨 Gann Square of 9 Levels
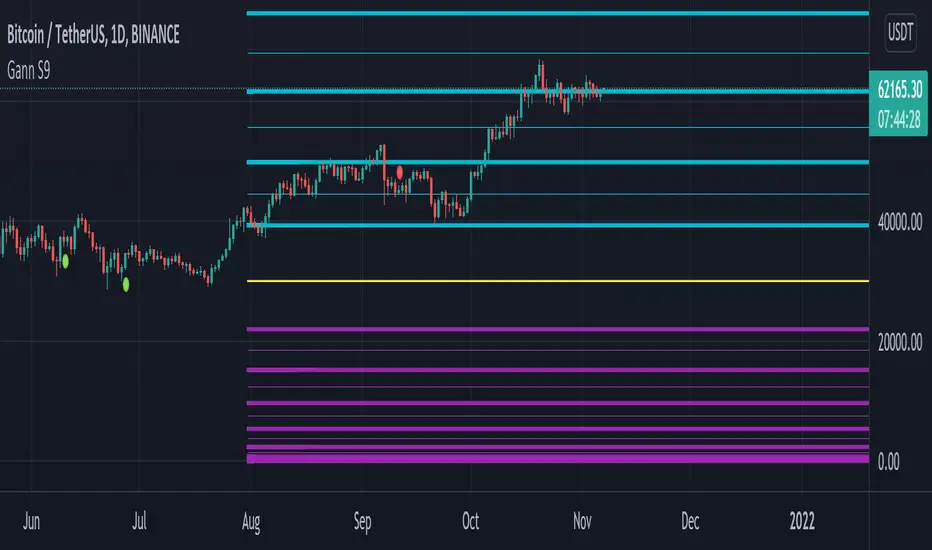
This indicator is designed based on Mr. WD Gann's square of nine methods.
Using this indicator, we can enter the desired pivot price and, based on the coefficient we assign to it, extract 8 support and resistance numbers with 8 angles of 45, 90, 135, 180, 225, 270, 315, and 360.
Calculates 8 support and resistance points and draws support and resistance lines.
The coefficient is to triple the number of executions.
To select pivot points in which a price is a large number, by selecting coefficients of 0.1, 0.01, 0.001, and 0.0001, we can have support and resistance points appropriate to the time frame.
For example, the price of Bitcoin, which was 64,854 on April 14, 2021, can be used to perform three-digit calculations by selecting a coefficient of 0.0001.
To select pivot points whose price is a small number, by selecting coefficients higher than 10, 100, 1000, and 10000, we can have support and resistance points appropriate to the time frame.
For example, the price of Dodge coin, which was 0.7399 on May 8, 2021, we can perform three-digit calculations by selecting a coefficient of 100 indicators.
릴리즈 노트
Added 50% levels between two level.Added Pivot Point Level with yellow color.
보호된 스크립트입니다
이 스크립트는 비공개 소스로 게시됩니다. 하지만 이를 자유롭게 제한 없이 사용할 수 있습니다 – 자세한 내용은 여기에서 확인하세요.
면책사항
해당 정보와 게시물은 금융, 투자, 트레이딩 또는 기타 유형의 조언이나 권장 사항으로 간주되지 않으며, 트레이딩뷰에서 제공하거나 보증하는 것이 아닙니다. 자세한 내용은 이용 약관을 참조하세요.
면책사항
해당 정보와 게시물은 금융, 투자, 트레이딩 또는 기타 유형의 조언이나 권장 사항으로 간주되지 않으며, 트레이딩뷰에서 제공하거나 보증하는 것이 아닙니다. 자세한 내용은 이용 약관을 참조하세요.