PROTECTED SOURCE SCRIPT
업데이트됨 structure break indicator
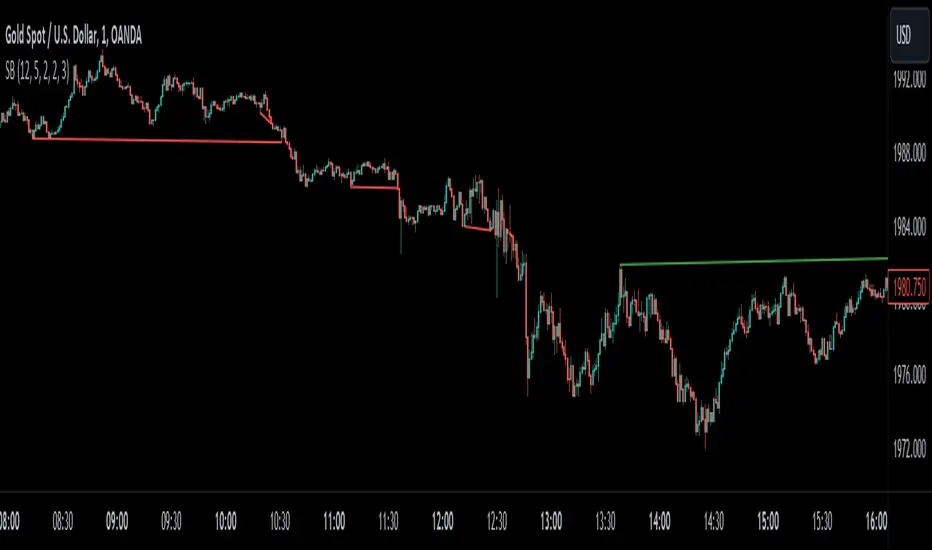
This indicator captures the beginning of a new trend or a correction. If higher highs are formed and the current low breaks the previous low, that means that a downward trend or correction is just beginning. Whereas if there are lower lows and the current high breaks the previous high, an upward trend or correction started. This uses the zigzag indicator made by DevLucem to check if highs and lows are broken or not. In the settings of this indicator you can change the colors of the lines, change the zigzag indicator's settings and choose to see the zigzag lines on your chart. Red colored lines are for bearish breaks and Green colored lines are for bullish breaks.
릴리즈 노트
I changed the colors of the bearish and bullish structure breaks to make it visually easy to see. Red lines signal that a downtrend just started and green lines signal that an uptrend just started릴리즈 노트
I changed the settings for the bullish and bearish breaks릴리즈 노트
I added alerts. The alert for an upward break is "🟢 Bullish break!" and "🔴 Bearish break!" for a downward break.Let me know if you want me to add something else!
보호된 스크립트입니다
이 스크립트는 비공개 소스로 게시됩니다. 하지만 이를 자유롭게 제한 없이 사용할 수 있습니다 – 자세한 내용은 여기에서 확인하세요.
면책사항
해당 정보와 게시물은 금융, 투자, 트레이딩 또는 기타 유형의 조언이나 권장 사항으로 간주되지 않으며, 트레이딩뷰에서 제공하거나 보증하는 것이 아닙니다. 자세한 내용은 이용 약관을 참조하세요.
보호된 스크립트입니다
이 스크립트는 비공개 소스로 게시됩니다. 하지만 이를 자유롭게 제한 없이 사용할 수 있습니다 – 자세한 내용은 여기에서 확인하세요.
면책사항
해당 정보와 게시물은 금융, 투자, 트레이딩 또는 기타 유형의 조언이나 권장 사항으로 간주되지 않으며, 트레이딩뷰에서 제공하거나 보증하는 것이 아닙니다. 자세한 내용은 이용 약관을 참조하세요.