OPEN-SOURCE SCRIPT
Williams Accelerator Oscillator — AC
What it is
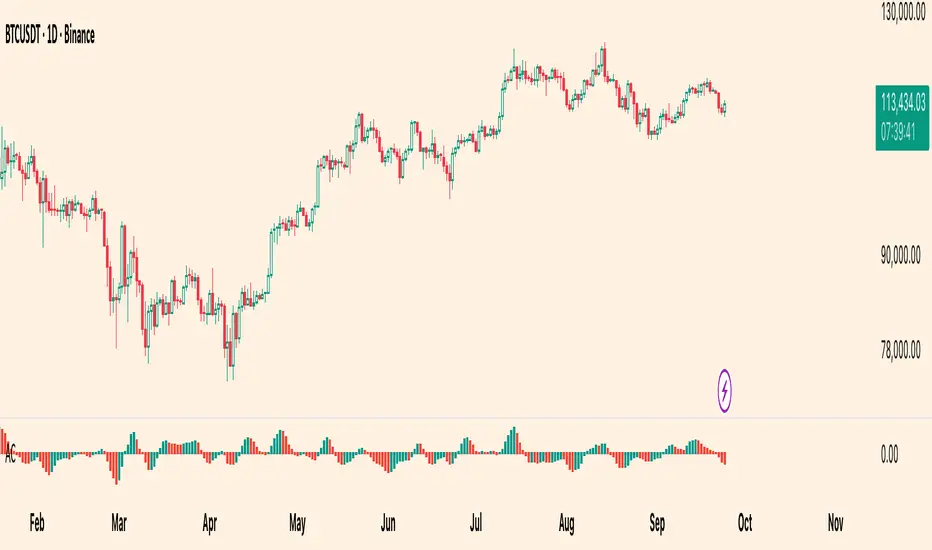
The Accelerator Oscillator (AC) measures the acceleration/deceleration of momentum. It’s derived from the Awesome Oscillator (AO) and shows whether momentum is speeding up or slowing down. In this implementation, columns are green when AC rises vs. the previous bar and red when it falls.
How it’s calculated
How to read it (typical interpretation)
Inputs
Plots
Alerts
Usage tips
Limitations
Credits
Concept by Bill Williams. This script is an independent implementation for educational and research purposes.
Disclaimer
No financial advice. Markets involve risk; test thoroughly before live use.
The Accelerator Oscillator (AC) measures the acceleration/deceleration of momentum. It’s derived from the Awesome Oscillator (AO) and shows whether momentum is speeding up or slowing down. In this implementation, columns are green when AC rises vs. the previous bar and red when it falls.
How it’s calculated
- Price source: Median Price (HL2) by default; Close can be used instead.
- AO = SMA(HL2, fastLen) − SMA(HL2, slowLen) (defaults: 5 & 34).
- AC = AO − SMA(AO, signalLen) (default: 5).
- Coloring: Green if AC > AC[1], else Red.
- Zero line (optional) helps contextualize acceleration around neutral.
How to read it (typical interpretation)
- Above 0: Upside acceleration (bullish pressure increasing).
- Below 0: Downside acceleration (bearish pressure increasing).
- Color sequences: Consecutive green columns suggest increasing upside acceleration; consecutive red columns suggest increasing downside acceleration.
- Note: AC reflects change in momentum, not trend direction by itself. Many traders confirm with trend filters or price structure before acting.
Inputs
- AO Fast SMA (default 5)
- AO Slow SMA (default 34)
- AC Signal SMA (default 5) — smoothing for the AO used in AC calc
- Use Median Price (HL2) for AO (on/off)
- Show zero line (on/off)
- Show AO (for reference) (on/off)
- Show AC signal (SMA of AO) (on/off)
Plots
- AC Histogram — column chart colored by acceleration (green/red).
- Zero — optional baseline at 0.
- AO — optional reference line.
- AO Signal (SMA) — optional smoothing line of AO.
Alerts
- AC crosses above 0 — acceleration flips positive.
- AC crosses below 0 — acceleration flips negative.
- AC green above zero — AC rising and > 0.
- AC red below zero — AC falling and < 0.
Usage tips
- On lower timeframes, consider a slightly larger signalLen to reduce noise.
- Confirm with price action, trend filters, or volatility context.
- Values update intrabar; for stricter signals, confirm on bar close.
Limitations
- AC is built from moving averages and is therefore lagging relative to raw price.
- It is not normalized; behavior can vary by instrument and timeframe.
- Do not use in isolation for entries/exits without risk management.
Credits
Concept by Bill Williams. This script is an independent implementation for educational and research purposes.
Disclaimer
No financial advice. Markets involve risk; test thoroughly before live use.
오픈 소스 스크립트
트레이딩뷰의 진정한 정신에 따라, 이 스크립트의 작성자는 이를 오픈소스로 공개하여 트레이더들이 기능을 검토하고 검증할 수 있도록 했습니다. 작성자에게 찬사를 보냅니다! 이 코드는 무료로 사용할 수 있지만, 코드를 재게시하는 경우 하우스 룰이 적용된다는 점을 기억하세요.
✅My Telegram
t.me/charyyevn
t.me/charyyevn
면책사항
해당 정보와 게시물은 금융, 투자, 트레이딩 또는 기타 유형의 조언이나 권장 사항으로 간주되지 않으며, 트레이딩뷰에서 제공하거나 보증하는 것이 아닙니다. 자세한 내용은 이용 약관을 참조하세요.