OPEN-SOURCE SCRIPT
Volume Zones Indicator
Volume Zones Indicator — VWAP with Dynamic Monthly Volume Zones
This indicator is an enhanced version of the classic VWAP (Volume Weighted Average Price), designed to create clear monthly zones around VWAP based on average price range (ATR) and volume activity.
The core idea is to highlight key zones where price is more likely to reverse or consolidate, based on where significant trading volume occurs.
How does it work?
VWAP is calculated over the last N days (set by the lookbackPeriod input).
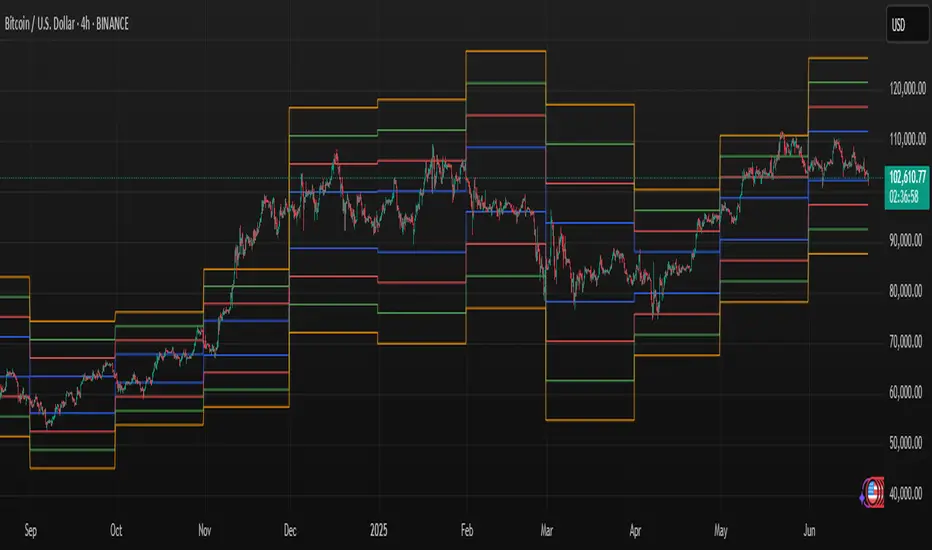
Four zones are plotted above and below VWAP, spaced using a multiple of ATR.
Each zone has its own color for clarity:
Blue — closest to VWAP
Red — second band
Green — third band
Orange — outer band (potential breakout or exhaustion zone)
If the current volume exceeds the moving average of volume, it is highlighted directly on the chart. This helps detect accumulation or distribution moments more easily.
What does the trader see?
You see horizontal colored bands on the chart that update at the start of each new month. These zones:
Remain fixed throughout the month
Automatically adjust based on recent volume and volatility
Act as dynamic support/resistance levels
Best used for:
Mean reversion strategies — identifying pullbacks toward value areas
Support and resistance mapping — automatic SR zones based on price/volume behavior
Breakout filtering — when price reaches zone 3 or 4, trend continuation or reversal is likely
Adding volume context to price action — works well with candlestick and pattern analysis
Settings
Lookback Period (Days): VWAP and volume smoothing length
Volume Area Threshold %: Reserved for future functionality
Works on any timeframe; best suited for 4H timeframe.
Zones are calculated and fixed monthly for clean visual context
Combines price structure with actual volume flow for more reliable decision-making
This indicator is an enhanced version of the classic VWAP (Volume Weighted Average Price), designed to create clear monthly zones around VWAP based on average price range (ATR) and volume activity.
The core idea is to highlight key zones where price is more likely to reverse or consolidate, based on where significant trading volume occurs.
How does it work?
VWAP is calculated over the last N days (set by the lookbackPeriod input).
Four zones are plotted above and below VWAP, spaced using a multiple of ATR.
Each zone has its own color for clarity:
Blue — closest to VWAP
Red — second band
Green — third band
Orange — outer band (potential breakout or exhaustion zone)
If the current volume exceeds the moving average of volume, it is highlighted directly on the chart. This helps detect accumulation or distribution moments more easily.
What does the trader see?
You see horizontal colored bands on the chart that update at the start of each new month. These zones:
Remain fixed throughout the month
Automatically adjust based on recent volume and volatility
Act as dynamic support/resistance levels
Best used for:
Mean reversion strategies — identifying pullbacks toward value areas
Support and resistance mapping — automatic SR zones based on price/volume behavior
Breakout filtering — when price reaches zone 3 or 4, trend continuation or reversal is likely
Adding volume context to price action — works well with candlestick and pattern analysis
Settings
Lookback Period (Days): VWAP and volume smoothing length
Volume Area Threshold %: Reserved for future functionality
Works on any timeframe; best suited for 4H timeframe.
Zones are calculated and fixed monthly for clean visual context
Combines price structure with actual volume flow for more reliable decision-making
오픈 소스 스크립트
트레이딩뷰의 진정한 정신에 따라, 이 스크립트의 작성자는 이를 오픈소스로 공개하여 트레이더들이 기능을 검토하고 검증할 수 있도록 했습니다. 작성자에게 찬사를 보냅니다! 이 코드는 무료로 사용할 수 있지만, 코드를 재게시하는 경우 하우스 룰이 적용된다는 점을 기억하세요.
면책사항
해당 정보와 게시물은 금융, 투자, 트레이딩 또는 기타 유형의 조언이나 권장 사항으로 간주되지 않으며, 트레이딩뷰에서 제공하거나 보증하는 것이 아닙니다. 자세한 내용은 이용 약관을 참조하세요.
오픈 소스 스크립트
트레이딩뷰의 진정한 정신에 따라, 이 스크립트의 작성자는 이를 오픈소스로 공개하여 트레이더들이 기능을 검토하고 검증할 수 있도록 했습니다. 작성자에게 찬사를 보냅니다! 이 코드는 무료로 사용할 수 있지만, 코드를 재게시하는 경우 하우스 룰이 적용된다는 점을 기억하세요.
면책사항
해당 정보와 게시물은 금융, 투자, 트레이딩 또는 기타 유형의 조언이나 권장 사항으로 간주되지 않으며, 트레이딩뷰에서 제공하거나 보증하는 것이 아닙니다. 자세한 내용은 이용 약관을 참조하세요.