PROTECTED SOURCE SCRIPT
업데이트됨 US Recessions with SPX reversals v3 [FornaxTV]
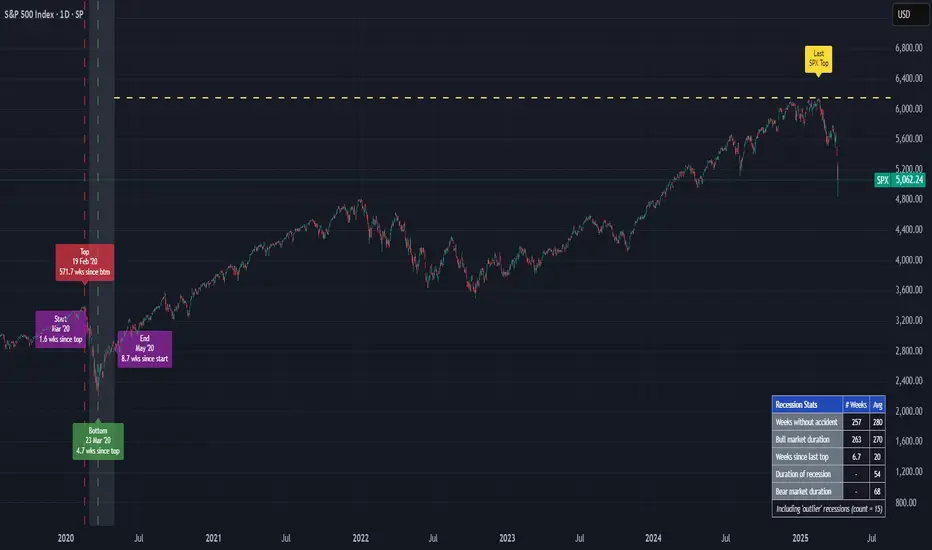
In addition to highlighting periods of official US recessions (as defined by the NBER) this script also displays vertical lines for the SPX market top and bottom associated with each recession.
This facilitates more detailed analysis of potential leading and coincident indicators for market tops and bottoms. This is particularly relevant for market tops, which typically precede the start of a recession by several months.
In addition to recessions with SPX market tops and market bottoms:
- A horizontal line can optionally be displayed for the last market top. (NOTE: this line will only be displayed for SPX tickers.)
- Labels can optionally be displayed for market tops & bottoms, plus the start and end of recessions. If the statistics are enabled (see below) these labels will also indicate the number of weeks between key market events, e.g. a market top and the start of a recession.
- A statistics table can optionally be displayed, contained statistics such as the number of weeks wince the last recession & market bottom, as well as averages for all recessions included in the analysis set.
For the recession statistics:
- "Outlier" recessions such as 1945 (WWII, where the market top occurred well after the recession itself) and 2020 (COVID pandemic, which was arguably not a "true" economic recession) can optionally be excluded.
- You can choose to exclude recessions occurring before a specific year.
릴리즈 노트
Fixed issue with "Last SPX Top" label display릴리즈 노트
Minor improvements to the (optional) summary table. All stats will be highlighted yellow if the current value exceeds the historical average, or red if the current value exceeds the historical average by more than 10%.보호된 스크립트입니다
이 스크립트는 비공개 소스로 게시됩니다. 하지만 이를 자유롭게 제한 없이 사용할 수 있습니다 – 자세한 내용은 여기에서 확인하세요.
면책사항
해당 정보와 게시물은 금융, 투자, 트레이딩 또는 기타 유형의 조언이나 권장 사항으로 간주되지 않으며, 트레이딩뷰에서 제공하거나 보증하는 것이 아닙니다. 자세한 내용은 이용 약관을 참조하세요.
면책사항
해당 정보와 게시물은 금융, 투자, 트레이딩 또는 기타 유형의 조언이나 권장 사항으로 간주되지 않으며, 트레이딩뷰에서 제공하거나 보증하는 것이 아닙니다. 자세한 내용은 이용 약관을 참조하세요.