OPEN-SOURCE SCRIPT
Deviation rate of Chinese stock market index
// Deviation rate of Chinese stock market index
//The purpose of the indicator is to monitor the Chinese stock market index deviation rate to the 20EMA, so each major index can be observed longitudinally at the same time.
//This indicator give signal of which Index or instrument should you be focused and when should you enter the market to get a long or short position.
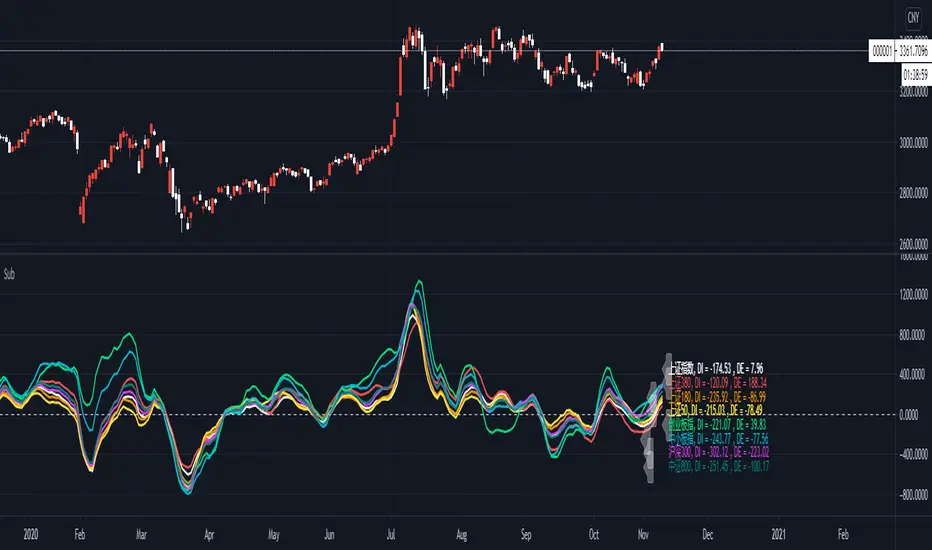
//The chart shows the deviation rate between the current price of each major index current price to the 20EMA.
//Also it count a deductive ratio between current price to the previous 20th bar close price to (which lead to the slope of the 20SMA)
//When using, adjust the corresponding period according to the chart period.
//The word DI (divergence) represents the deviation value between the current price and 20EMA, and DE (deduction) represents the deviation value between the current price and the 20 deduction price.
//Attention marker: The marker tells one of the moving average (EMA20 and MA20) is turning towards the opposite direction. When DE and DI one is plus , one is minus [divergence ratio>0 and deduction ratio <0 ( or vise versa)] attention marker appear on the instrument title.
//Take the bull trend as an example. If the price is higher than ema20, the EMA20 is turning.If the price is higher than the close price of the bar 20 days ago , the sma20 is turning.
//When the ema20 has not turned around to opposite direction , and the ma20 is turning , the deviation rate of the moving average and the deviation rate of the deductible price are different in positive or negative.
//The marker as a reminder will appear on the instrument title.
//How to use this watchlist: You can freely replace the major indices with the instrument you are focused.
//The purpose of the indicator is to monitor the Chinese stock market index deviation rate to the 20EMA, so each major index can be observed longitudinally at the same time.
//This indicator give signal of which Index or instrument should you be focused and when should you enter the market to get a long or short position.
//The chart shows the deviation rate between the current price of each major index current price to the 20EMA.
//Also it count a deductive ratio between current price to the previous 20th bar close price to (which lead to the slope of the 20SMA)
//When using, adjust the corresponding period according to the chart period.
//The word DI (divergence) represents the deviation value between the current price and 20EMA, and DE (deduction) represents the deviation value between the current price and the 20 deduction price.
//Attention marker: The marker tells one of the moving average (EMA20 and MA20) is turning towards the opposite direction. When DE and DI one is plus , one is minus [divergence ratio>0 and deduction ratio <0 ( or vise versa)] attention marker appear on the instrument title.
//Take the bull trend as an example. If the price is higher than ema20, the EMA20 is turning.If the price is higher than the close price of the bar 20 days ago , the sma20 is turning.
//When the ema20 has not turned around to opposite direction , and the ma20 is turning , the deviation rate of the moving average and the deviation rate of the deductible price are different in positive or negative.
//The marker as a reminder will appear on the instrument title.
//How to use this watchlist: You can freely replace the major indices with the instrument you are focused.
오픈 소스 스크립트
트레이딩뷰의 진정한 정신에 따라, 이 스크립트의 작성자는 이를 오픈소스로 공개하여 트레이더들이 기능을 검토하고 검증할 수 있도록 했습니다. 작성자에게 찬사를 보냅니다! 이 코드는 무료로 사용할 수 있지만, 코드를 재게시하는 경우 하우스 룰이 적용된다는 점을 기억하세요.
면책사항
해당 정보와 게시물은 금융, 투자, 트레이딩 또는 기타 유형의 조언이나 권장 사항으로 간주되지 않으며, 트레이딩뷰에서 제공하거나 보증하는 것이 아닙니다. 자세한 내용은 이용 약관을 참조하세요.
오픈 소스 스크립트
트레이딩뷰의 진정한 정신에 따라, 이 스크립트의 작성자는 이를 오픈소스로 공개하여 트레이더들이 기능을 검토하고 검증할 수 있도록 했습니다. 작성자에게 찬사를 보냅니다! 이 코드는 무료로 사용할 수 있지만, 코드를 재게시하는 경우 하우스 룰이 적용된다는 점을 기억하세요.
면책사항
해당 정보와 게시물은 금융, 투자, 트레이딩 또는 기타 유형의 조언이나 권장 사항으로 간주되지 않으며, 트레이딩뷰에서 제공하거나 보증하는 것이 아닙니다. 자세한 내용은 이용 약관을 참조하세요.