PROTECTED SOURCE SCRIPT
Support and Resistance Index {Fournier-Eaton}
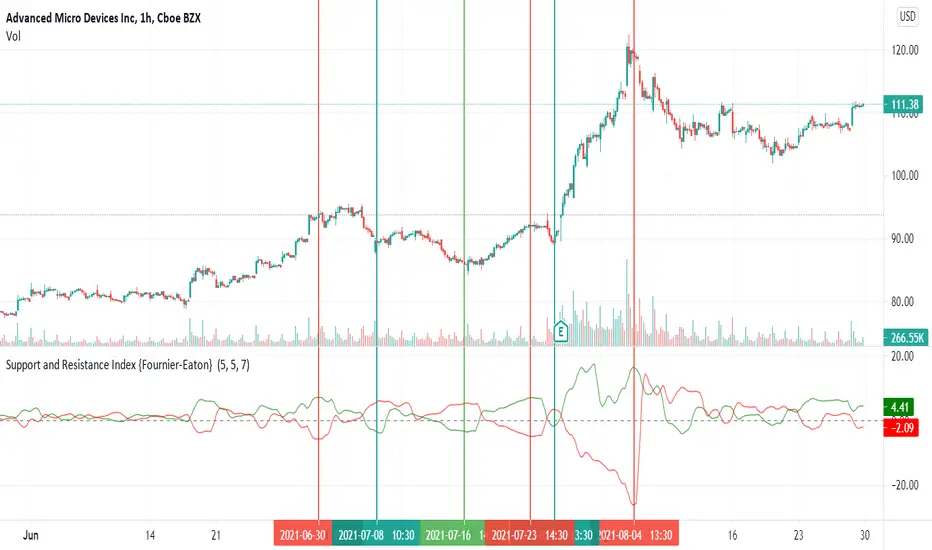
This algorithm quantifies the amount of pressure applied by support and resistance and helps confirm trend initiation as levels, relative to horizontal supports and resistances are broken.
Look for spread in the red and green lines
More succinctly:
Shape and relative values (wide green over red etc), not indicator values are of importance, are the most important.
Feedback is always helpful and I hope you find this useful.
Look for spread in the red and green lines
- A low spread will usually indicate a rangebound stock as it is pressured on both sides equally by resistance and support
- A high spread will typically indicate a stock prepared to make a new directional move.
- A widening spread will indicate the continuation of a trend
- A narrowing spread will indicate the beginning of a reversal.
More succinctly:
- A large spread with RED OVER GREEN indicates a high probability of upward reversal -- think downtrend is exhausted.
- A large spread with GREEN OVER RED indicates a high probability of downward reversal -- think uptrend is exhausted.
Shape and relative values (wide green over red etc), not indicator values are of importance, are the most important.
Feedback is always helpful and I hope you find this useful.
보호된 스크립트입니다
이 스크립트는 비공개 소스로 게시됩니다. 하지만 이를 자유롭게 제한 없이 사용할 수 있습니다 – 자세한 내용은 여기에서 확인하세요.
면책사항
해당 정보와 게시물은 금융, 투자, 트레이딩 또는 기타 유형의 조언이나 권장 사항으로 간주되지 않으며, 트레이딩뷰에서 제공하거나 보증하는 것이 아닙니다. 자세한 내용은 이용 약관을 참조하세요.
면책사항
해당 정보와 게시물은 금융, 투자, 트레이딩 또는 기타 유형의 조언이나 권장 사항으로 간주되지 않으며, 트레이딩뷰에서 제공하거나 보증하는 것이 아닙니다. 자세한 내용은 이용 약관을 참조하세요.