PROTECTED SOURCE SCRIPT
업데이트됨 Stochastic RSMFI Ribbon
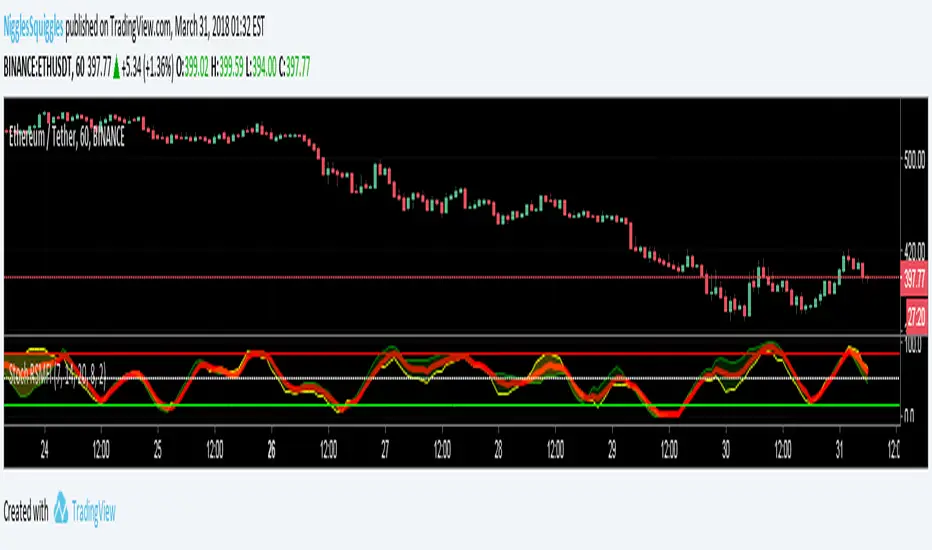
For those of you who like to use the StochasticRSI, this indicator adds a StochasticMFI (Money Flow) into the mix, making it volume weighted.
The red signal line is the StochasticRSI and StochasticMFI averaged together.
The green and yellow ribbon is the two plot lines filled in and coloured depending on which is greater (RSI or MFI).
// Created 2018 - by squiggles#8806
// LTC Tip Jar: LX4bUBdjiRPsagUbZoAczSGgDC4YqTJL7w
The red signal line is the StochasticRSI and StochasticMFI averaged together.
The green and yellow ribbon is the two plot lines filled in and coloured depending on which is greater (RSI or MFI).
// Created 2018 - by squiggles#8806
// LTC Tip Jar: LX4bUBdjiRPsagUbZoAczSGgDC4YqTJL7w
릴리즈 노트
Added the ability to plot standard RSI and MFI alongside the ribbon, I also made it so you can turn them all on or off as you wish.To make viewing RSI and MFI easier while the ribbon is visible, I made it so the RSI and MFI can be offset.
The RSI and MFI plot lines will also highlight when they are beyond the standard limits (RSI - 70, 30; MFI - 80, 20)
So now this indicator is three indicators in one...
Enjoy!!!
보호된 스크립트입니다
이 스크립트는 비공개 소스로 게시됩니다. 하지만 이를 자유롭게 제한 없이 사용할 수 있습니다 – 자세한 내용은 여기에서 확인하세요.
면책사항
해당 정보와 게시물은 금융, 투자, 트레이딩 또는 기타 유형의 조언이나 권장 사항으로 간주되지 않으며, 트레이딩뷰에서 제공하거나 보증하는 것이 아닙니다. 자세한 내용은 이용 약관을 참조하세요.
보호된 스크립트입니다
이 스크립트는 비공개 소스로 게시됩니다. 하지만 이를 자유롭게 제한 없이 사용할 수 있습니다 – 자세한 내용은 여기에서 확인하세요.
면책사항
해당 정보와 게시물은 금융, 투자, 트레이딩 또는 기타 유형의 조언이나 권장 사항으로 간주되지 않으며, 트레이딩뷰에서 제공하거나 보증하는 것이 아닙니다. 자세한 내용은 이용 약관을 참조하세요.