OPEN-SOURCE SCRIPT
ABC Pattern
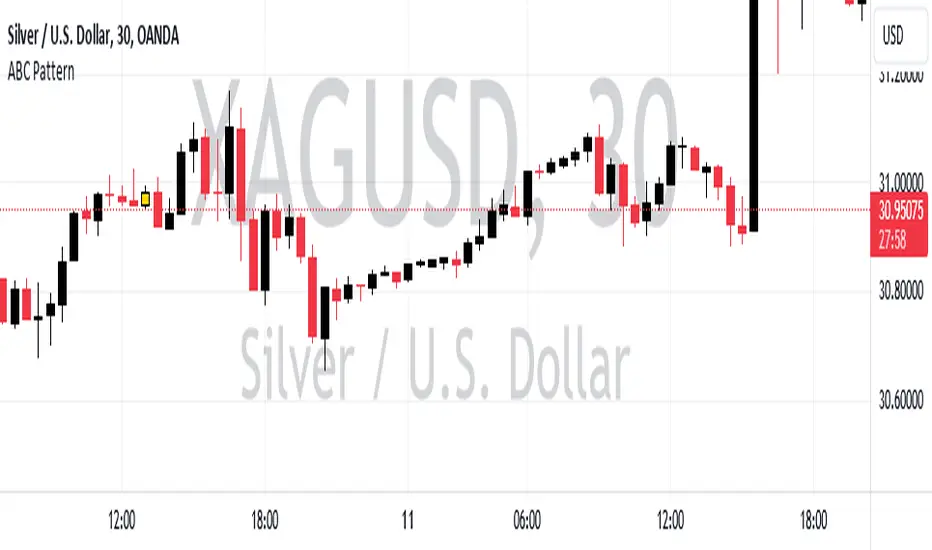
The indicator, named "ABC Pattern," is designed to identify specific bullish and bearish patterns on a price chart. Here's a simple explanation of what it does:
What the Indicator Does:
1. Identifies Bullish Patterns:
- The indicator looks for a sequence of candles where certain conditions are met to form a bullish pattern.
- When it detects a bullish pattern, it colors the candle that occurred three periods ago in gold.
2. Identifies Bearish Patterns:
- Similarly, it looks for a sequence of candles where certain conditions are met to form a bearish pattern.
- When it detects a bearish pattern, it colors the candle that occurred three periods ago in pinkish.
3. Creates Alerts:
- Whenever a bullish or bearish pattern is identified, the indicator generates an alert.
- The alert message includes the type of pattern (bullish or bearish), the price level at the time of detection, and the date and time of the pattern formation.
Detailed Conditions:
- Bullish Pattern:
- The current candle closes higher than it opened.
- The previous candle also closes higher than it opened.
- Two candles ago, the candle closed lower than it opened.
- Three candles ago, the candle closed higher than it opened.
- The highest price of two candles ago is below the current close.
- The lowest price of three candles ago is above the close of two candles ago.
- The highest price of three candles ago is below the current close.
- Bearish Pattern:
- The current candle closes lower than it opened.
- The previous candle also closes lower than it opened.
- Two candles ago, the candle closed higher than it opened.
- Three candles ago, the candle closed lower than it opened.
- The lowest price of two candles ago is above the current close.
- The highest price of three candles ago is below the close of two candles ago.
- The lowest price of three candles ago is above the current close.
Visual Representation:
- Gold Color: Indicates a detected bullish pattern.
- Pinkish Color: Indicates a detected bearish pattern.
Alerts:
- Alert Message: "ABC Pattern has appeared!"
- Detailed Alerts: Include the type of pattern, price level, and timestamp for better analysis and decision-making.
This indicator helps traders visually and audibly detect potential bullish and bearish patterns on their charts, aiding in making more informed trading decisions.
오픈 소스 스크립트
트레이딩뷰의 진정한 정신에 따라, 이 스크립트의 작성자는 이를 오픈소스로 공개하여 트레이더들이 기능을 검토하고 검증할 수 있도록 했습니다. 작성자에게 찬사를 보냅니다! 이 코드는 무료로 사용할 수 있지만, 코드를 재게시하는 경우 하우스 룰이 적용된다는 점을 기억하세요.
면책사항
해당 정보와 게시물은 금융, 투자, 트레이딩 또는 기타 유형의 조언이나 권장 사항으로 간주되지 않으며, 트레이딩뷰에서 제공하거나 보증하는 것이 아닙니다. 자세한 내용은 이용 약관을 참조하세요.
오픈 소스 스크립트
트레이딩뷰의 진정한 정신에 따라, 이 스크립트의 작성자는 이를 오픈소스로 공개하여 트레이더들이 기능을 검토하고 검증할 수 있도록 했습니다. 작성자에게 찬사를 보냅니다! 이 코드는 무료로 사용할 수 있지만, 코드를 재게시하는 경우 하우스 룰이 적용된다는 점을 기억하세요.
면책사항
해당 정보와 게시물은 금융, 투자, 트레이딩 또는 기타 유형의 조언이나 권장 사항으로 간주되지 않으며, 트레이딩뷰에서 제공하거나 보증하는 것이 아닙니다. 자세한 내용은 이용 약관을 참조하세요.