PROTECTED SOURCE SCRIPT
업데이트됨 Index Lead Lag
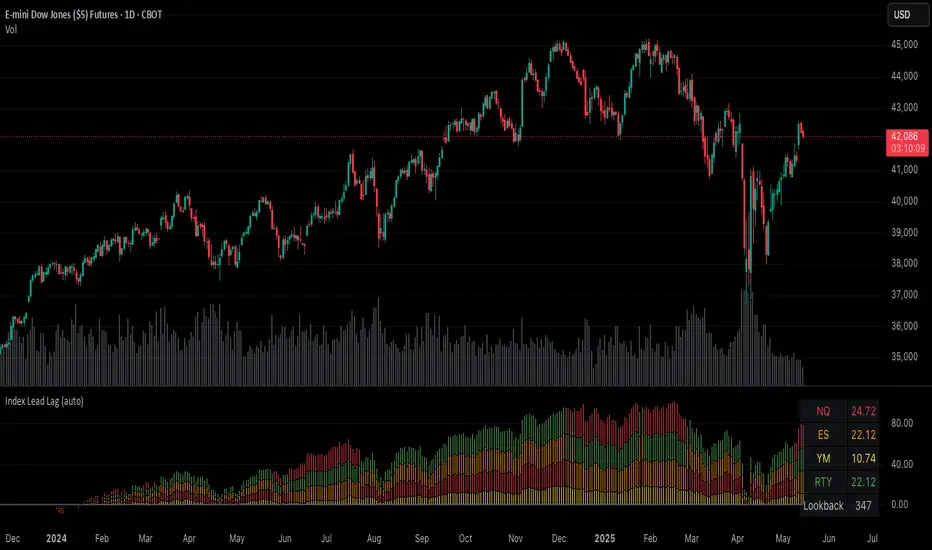
Plots the percent change of each index over a given input lookback window length.
Indices are color coded (and customizable) to identify their respective percent change in the stacked column plot.
Table at the bottom right shows the previously closed bar's percent changes.
Indicator indicates which indices are leading and lagging over the given lookback period.
Indices are color coded (and customizable) to identify their respective percent change in the stacked column plot.
Table at the bottom right shows the previously closed bar's percent changes.
Indicator indicates which indices are leading and lagging over the given lookback period.
릴리즈 노트
Add index changes to status line visualization릴리즈 노트
Updated default lookback length for improved visibility of trend릴리즈 노트
Added an optional highlight on the reference bar anchor for the current bar's percent change calculation. Highlighted bar appears `lookback window bars input` to the left of the current bar.릴리즈 노트
Adds a vertical bar selector for the comparison start point. Click on the indicator then move the vertical bar to the desired chart data.릴리즈 노트
Allow setting comparison anchor point between:* Time based using vertical selector bar (or timestamp input option)
* Fixed number of bars
릴리즈 노트
bug fix with disabling the table view릴리즈 노트
try that again릴리즈 노트
v1.1Added a zero reference line on the plot to distinguish positive and negative changes.
보호된 스크립트입니다
이 스크립트는 비공개 소스로 게시됩니다. 하지만 이를 자유롭게 제한 없이 사용할 수 있습니다 – 자세한 내용은 여기에서 확인하세요.
면책사항
해당 정보와 게시물은 금융, 투자, 트레이딩 또는 기타 유형의 조언이나 권장 사항으로 간주되지 않으며, 트레이딩뷰에서 제공하거나 보증하는 것이 아닙니다. 자세한 내용은 이용 약관을 참조하세요.
보호된 스크립트입니다
이 스크립트는 비공개 소스로 게시됩니다. 하지만 이를 자유롭게 제한 없이 사용할 수 있습니다 – 자세한 내용은 여기에서 확인하세요.
면책사항
해당 정보와 게시물은 금융, 투자, 트레이딩 또는 기타 유형의 조언이나 권장 사항으로 간주되지 않으며, 트레이딩뷰에서 제공하거나 보증하는 것이 아닙니다. 자세한 내용은 이용 약관을 참조하세요.