OPEN-SOURCE SCRIPT
업데이트됨 Gap Size Outcome Statistics [vnhilton]
This indicator displays a table with statistics showing the outcomes of gap ups or downs based on your threshold (i.e. does the day end in green or red?). This can be useful for trading, where you're using relevant ETFs & see that they've gapped up/down, & can assume based on statistics that the ETF will end in green/red depending on which has the higher probability (however, you can use these on any other instruments such as stocks to find edges e.g. seeing whether stock XYZ is more likely to end in green/red when it gaps up 100%).
The table also includes sample sizes for your threshold tests for more confidence in the statistics, & also displays average gap up & downs & their respective sample sizes as well. This indicator is intended to be used on the daily timeframe, but can be used on lower or higher timeframes if you prefer.
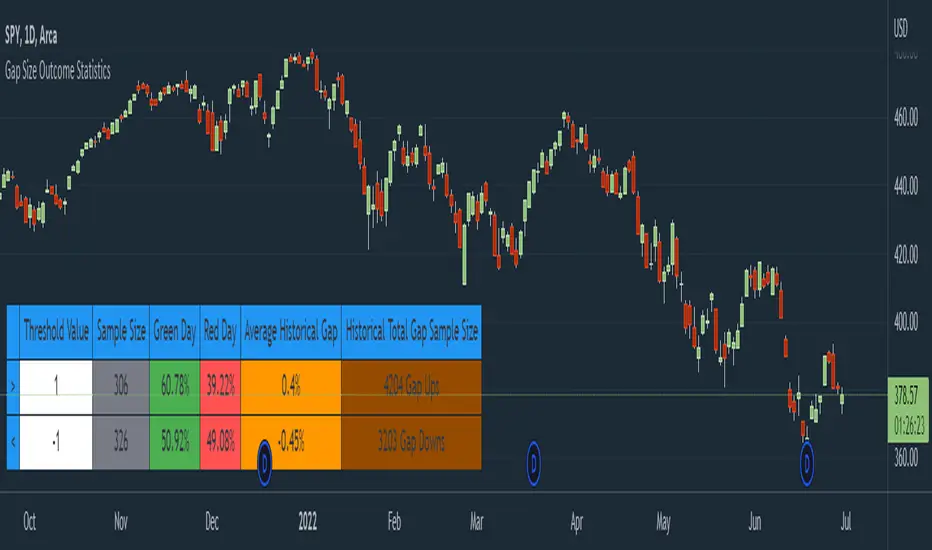
In the chart snapshot image above, we can see that when the SPY gaps up > 1%, the day is more likely to end in green than in red. But when the SPY gaps down < -1%, it's also more likely to end in green than in red.
(IMPORTANT NOTE: There's 1 limitation with this indicator & it's that it assumes that days where close=open are green days, & that 0% gaps exact are considered gap ups.)
The table also includes sample sizes for your threshold tests for more confidence in the statistics, & also displays average gap up & downs & their respective sample sizes as well. This indicator is intended to be used on the daily timeframe, but can be used on lower or higher timeframes if you prefer.
In the chart snapshot image above, we can see that when the SPY gaps up > 1%, the day is more likely to end in green than in red. But when the SPY gaps down < -1%, it's also more likely to end in green than in red.
(IMPORTANT NOTE: There's 1 limitation with this indicator & it's that it assumes that days where close=open are green days, & that 0% gaps exact are considered gap ups.)
릴리즈 노트
- Fixed a bug for gap down input (forgot minus sign for minimum value input of -100)릴리즈 노트
-Fixed chart snapshot image릴리즈 노트
- fixed chart snapshot image (again)릴리즈 노트
- Rearranged some columns & made headers clearer 오픈 소스 스크립트
트레이딩뷰의 진정한 정신에 따라, 이 스크립트의 작성자는 이를 오픈소스로 공개하여 트레이더들이 기능을 검토하고 검증할 수 있도록 했습니다. 작성자에게 찬사를 보냅니다! 이 코드는 무료로 사용할 수 있지만, 코드를 재게시하는 경우 하우스 룰이 적용된다는 점을 기억하세요.
면책사항
해당 정보와 게시물은 금융, 투자, 트레이딩 또는 기타 유형의 조언이나 권장 사항으로 간주되지 않으며, 트레이딩뷰에서 제공하거나 보증하는 것이 아닙니다. 자세한 내용은 이용 약관을 참조하세요.
오픈 소스 스크립트
트레이딩뷰의 진정한 정신에 따라, 이 스크립트의 작성자는 이를 오픈소스로 공개하여 트레이더들이 기능을 검토하고 검증할 수 있도록 했습니다. 작성자에게 찬사를 보냅니다! 이 코드는 무료로 사용할 수 있지만, 코드를 재게시하는 경우 하우스 룰이 적용된다는 점을 기억하세요.
면책사항
해당 정보와 게시물은 금융, 투자, 트레이딩 또는 기타 유형의 조언이나 권장 사항으로 간주되지 않으며, 트레이딩뷰에서 제공하거나 보증하는 것이 아닙니다. 자세한 내용은 이용 약관을 참조하세요.