PROTECTED SOURCE SCRIPT
업데이트됨 MACD X Pivot
The Theory of Entanglement (缠论) is one of the most widely studied trading theories in China, but it is much less known among traders outside. Fractals, strokes, line segments and pivots are basic elements in the Theory of Entanglement. This indicator, MACD X Pivot, applies the concept of strokes, line segment and pivot to the classic MACD indicator and provides a good indication of the exact turning point of a trend based on MACD divergence. Also see a related indicator for applying the Theory of Entanglement on the price chart: tradingview.com/script/5khLVtBp/.
Relations between stroke, line segment and pivot:
• Stroke: Connecting two adjacent top and bottom fractals with at least one candlestick in between.
• Line segment: Consists of an odd number of strokes, at least three strokes are required, and the first three strokes must have overlapping parts.
• Pivot: The part of a trend type at a certain level that is overlapped by at least three consecutive sub-level trend types.
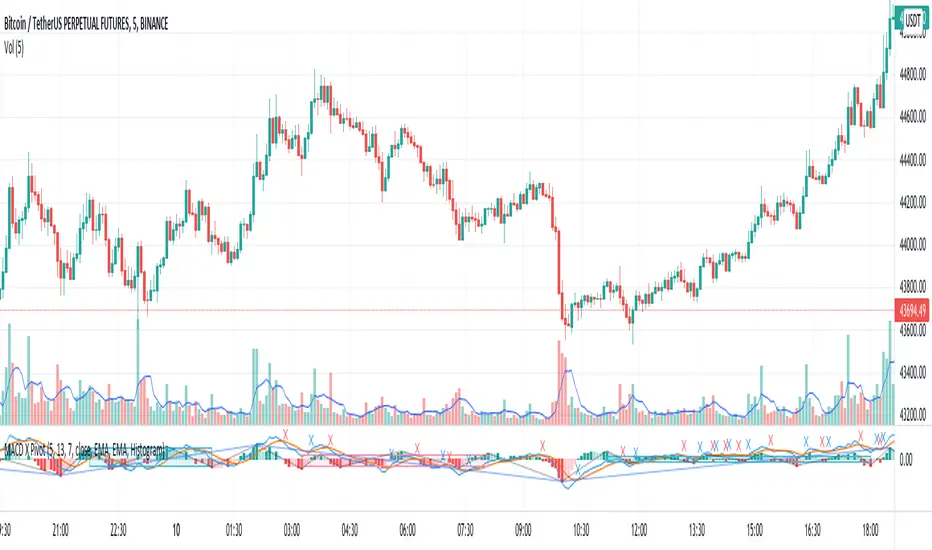
List of drawings on the chart:
1. Blue and red crosses: golden and death crosses between MACD and signal lines.
1. Gray lines: Strokes at the current level.
2. Blue lines: Strokes at a higher level, also line segments at the current level.
3. Blue shaded rectangles: Bullish pivot.
4. Red shaded rectangles: Bearish pivot.
How to use the indicator:
1. The golden cross and death cross between the MACD and signal lines: Blue cross: MACD line crosses up the signal line - buy signal; Red cross: MACD line crosses down the signal line: sell signal.
2. For the bullish blue pivot, the 2nd low (higher low) provides a good indication of the exact turning point from a bearish to bullish trend.
3. For the bearish red pivot, the 2nd high (lower high) provides a good indication of the exact turning point from a bullish to bearish trend.
Relations between stroke, line segment and pivot:
• Stroke: Connecting two adjacent top and bottom fractals with at least one candlestick in between.
• Line segment: Consists of an odd number of strokes, at least three strokes are required, and the first three strokes must have overlapping parts.
• Pivot: The part of a trend type at a certain level that is overlapped by at least three consecutive sub-level trend types.
List of drawings on the chart:
1. Blue and red crosses: golden and death crosses between MACD and signal lines.
1. Gray lines: Strokes at the current level.
2. Blue lines: Strokes at a higher level, also line segments at the current level.
3. Blue shaded rectangles: Bullish pivot.
4. Red shaded rectangles: Bearish pivot.
How to use the indicator:
1. The golden cross and death cross between the MACD and signal lines: Blue cross: MACD line crosses up the signal line - buy signal; Red cross: MACD line crosses down the signal line: sell signal.
2. For the bullish blue pivot, the 2nd low (higher low) provides a good indication of the exact turning point from a bearish to bullish trend.
3. For the bearish red pivot, the 2nd high (lower high) provides a good indication of the exact turning point from a bullish to bearish trend.
릴리즈 노트
Modified several input parameters to improve signal reliability.릴리즈 노트
Separated input parameter settings for MACD, signal lines and histogram.릴리즈 노트
1. Added a new MACD line for identifying higher-level divergence. 2. Adjusted scales of MACD and signal lines and height of histogram for better clarity.릴리즈 노트
Minor bug fix.보호된 스크립트입니다
이 스크립트는 비공개 소스로 게시됩니다. 하지만 이를 자유롭게 제한 없이 사용할 수 있습니다 – 자세한 내용은 여기에서 확인하세요.
면책사항
해당 정보와 게시물은 금융, 투자, 트레이딩 또는 기타 유형의 조언이나 권장 사항으로 간주되지 않으며, 트레이딩뷰에서 제공하거나 보증하는 것이 아닙니다. 자세한 내용은 이용 약관을 참조하세요.
보호된 스크립트입니다
이 스크립트는 비공개 소스로 게시됩니다. 하지만 이를 자유롭게 제한 없이 사용할 수 있습니다 – 자세한 내용은 여기에서 확인하세요.
면책사항
해당 정보와 게시물은 금융, 투자, 트레이딩 또는 기타 유형의 조언이나 권장 사항으로 간주되지 않으며, 트레이딩뷰에서 제공하거나 보증하는 것이 아닙니다. 자세한 내용은 이용 약관을 참조하세요.