OPEN-SOURCE SCRIPT
Williams %R with EMA's
The provided Pine Script code presents a comprehensive technical trading strategy on the TradingView platform, incorporating the Williams %R indicator, exponential moving averages (EMAs), and upper bands for enhanced decision-making. This strategy aims to help traders identify potential buy and sell signals based on various technical indicators, thereby facilitating more informed trading decisions.
The key components of this strategy are as follows:
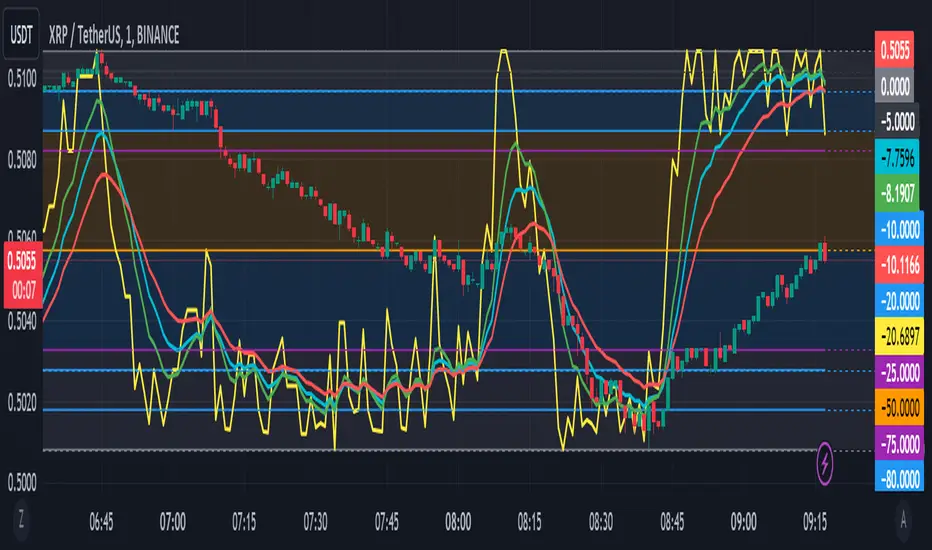
**Williams %R Indicator:** The Williams %R, also known as the "Willy," is a momentum oscillator that measures overbought and oversold conditions. In this code, the Williams %R is calculated with a user-defined period (default 21) and smoothed using an exponential moving average (EMA).
**Exponential Moving Averages (EMAs):** Two EMAs are computed on the Williams %R values. The "Fast" EMA (default 8) responds quickly to price changes, while the "Slow" EMA (default 21) provides a smoother trend-following signal. Crossovers and divergences between these EMAs can indicate potential buy or sell opportunities.
**Candle Color Detection:** The code also tracks the color of candlesticks, distinguishing between green (bullish) and red (bearish) candles. This information is used in conjunction with other indicators to identify specific trading conditions.
**Additional Upper Bands:** The script introduces upper bands at various levels (-5, -10, -20, -25) to create zones for potential buy and sell signals. These bands are visually represented on the chart and can help traders gauge the strength of a trend.
**Alert Conditions:** The code includes several alert conditions that trigger notifications when specific events occur, such as %R crossing certain levels, candle color changes within predefined upper bands, and EMA crossovers.
**Background Highlighting:** The upper bands and the zero line are visually highlighted with different colors, making it easier for traders to identify critical price levels.
This code is valuable for traders seeking a versatile technical strategy that combines multiple indicators to improve trading decisions. By incorporating the Williams %R, EMAs, candlestick analysis, and upper bands, it offers a holistic approach to technical analysis. Traders can customize the parameters to align with their trading preferences and risk tolerance. The use of alerts ensures that traders are promptly notified of potential trade setups, allowing for timely execution and risk management. Overall, this code serves as a valuable tool for traders looking to make more informed decisions in the dynamic world of financial markets.
The key components of this strategy are as follows:
**Williams %R Indicator:** The Williams %R, also known as the "Willy," is a momentum oscillator that measures overbought and oversold conditions. In this code, the Williams %R is calculated with a user-defined period (default 21) and smoothed using an exponential moving average (EMA).
**Exponential Moving Averages (EMAs):** Two EMAs are computed on the Williams %R values. The "Fast" EMA (default 8) responds quickly to price changes, while the "Slow" EMA (default 21) provides a smoother trend-following signal. Crossovers and divergences between these EMAs can indicate potential buy or sell opportunities.
**Candle Color Detection:** The code also tracks the color of candlesticks, distinguishing between green (bullish) and red (bearish) candles. This information is used in conjunction with other indicators to identify specific trading conditions.
**Additional Upper Bands:** The script introduces upper bands at various levels (-5, -10, -20, -25) to create zones for potential buy and sell signals. These bands are visually represented on the chart and can help traders gauge the strength of a trend.
**Alert Conditions:** The code includes several alert conditions that trigger notifications when specific events occur, such as %R crossing certain levels, candle color changes within predefined upper bands, and EMA crossovers.
**Background Highlighting:** The upper bands and the zero line are visually highlighted with different colors, making it easier for traders to identify critical price levels.
This code is valuable for traders seeking a versatile technical strategy that combines multiple indicators to improve trading decisions. By incorporating the Williams %R, EMAs, candlestick analysis, and upper bands, it offers a holistic approach to technical analysis. Traders can customize the parameters to align with their trading preferences and risk tolerance. The use of alerts ensures that traders are promptly notified of potential trade setups, allowing for timely execution and risk management. Overall, this code serves as a valuable tool for traders looking to make more informed decisions in the dynamic world of financial markets.
오픈 소스 스크립트
트레이딩뷰의 진정한 정신에 따라, 이 스크립트의 작성자는 이를 오픈소스로 공개하여 트레이더들이 기능을 검토하고 검증할 수 있도록 했습니다. 작성자에게 찬사를 보냅니다! 이 코드는 무료로 사용할 수 있지만, 코드를 재게시하는 경우 하우스 룰이 적용된다는 점을 기억하세요.
면책사항
해당 정보와 게시물은 금융, 투자, 트레이딩 또는 기타 유형의 조언이나 권장 사항으로 간주되지 않으며, 트레이딩뷰에서 제공하거나 보증하는 것이 아닙니다. 자세한 내용은 이용 약관을 참조하세요.
오픈 소스 스크립트
트레이딩뷰의 진정한 정신에 따라, 이 스크립트의 작성자는 이를 오픈소스로 공개하여 트레이더들이 기능을 검토하고 검증할 수 있도록 했습니다. 작성자에게 찬사를 보냅니다! 이 코드는 무료로 사용할 수 있지만, 코드를 재게시하는 경우 하우스 룰이 적용된다는 점을 기억하세요.
면책사항
해당 정보와 게시물은 금융, 투자, 트레이딩 또는 기타 유형의 조언이나 권장 사항으로 간주되지 않으며, 트레이딩뷰에서 제공하거나 보증하는 것이 아닙니다. 자세한 내용은 이용 약관을 참조하세요.