OPEN-SOURCE SCRIPT
업데이트됨 vertical_pricer
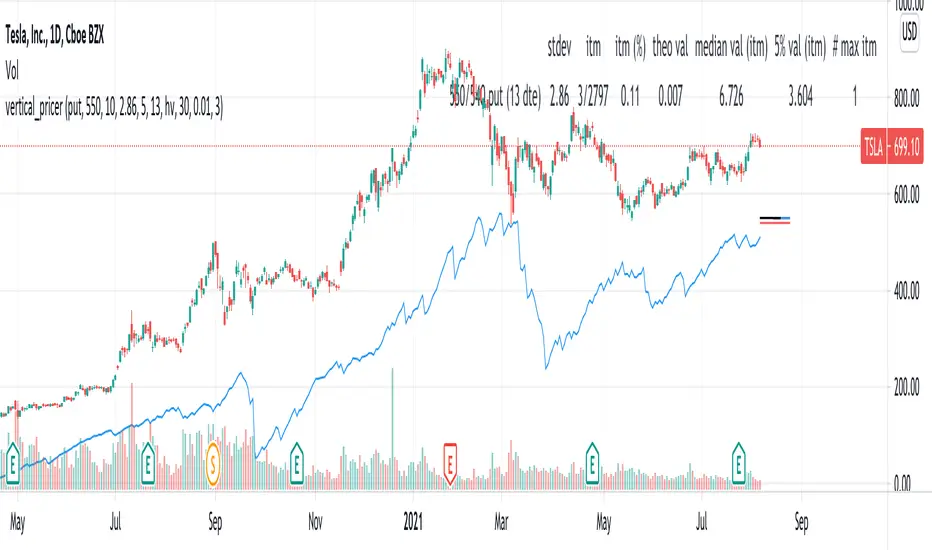
USAGE
1. Select the type of contract (call or put), the long strike, and the width.
2. Select the volatility model
3. The standard deviation is shown, enter it into the input.
The tool gives a theoretical price of a vertical spread, based on a
historical sample. The test assumes that a spread of equal width was sold on
every prior trading day at the given standard deviation, based on the
volatility model and duration of the contract. For example, if the 20 dte
110 strike is presently two standard deviations based on the 30 period
historical volatility, then the theoretical value is the average price all
2SD (at 20 dte) calls upon expiration, limited by the width of the spread and
normalized according to the present value of the underlying.
Other statistics include:
- The number of spreads in the sample, and percentage expired itm
- The median value at expiration
- The Nth percentile value of spreads at expiration
- The number of spreads that expired at max loss
Check the script comments and release notes for further updates, since Tradingview doesn't allow me to edit this description.
릴리즈 노트
bug fix -- was using the wrong array for theo vals. should be working now.릴리즈 노트
Minor documentation changes.릴리즈 노트
- added far strike to description cell in the table- set past forecast plot to be visible by default, since it doesn't clutter the view too much
릴리즈 노트
fix lines, they should project the latest forecast for the proper number of bars now릴리즈 노트
- annualize with 252, rather than 365 periodsNote: this script is meant for the daily chart
오픈 소스 스크립트
트레이딩뷰의 진정한 정신에 따라, 이 스크립트의 작성자는 이를 오픈소스로 공개하여 트레이더들이 기능을 검토하고 검증할 수 있도록 했습니다. 작성자에게 찬사를 보냅니다! 이 코드는 무료로 사용할 수 있지만, 코드를 재게시하는 경우 하우스 룰이 적용된다는 점을 기억하세요.
면책사항
해당 정보와 게시물은 금융, 투자, 트레이딩 또는 기타 유형의 조언이나 권장 사항으로 간주되지 않으며, 트레이딩뷰에서 제공하거나 보증하는 것이 아닙니다. 자세한 내용은 이용 약관을 참조하세요.
오픈 소스 스크립트
트레이딩뷰의 진정한 정신에 따라, 이 스크립트의 작성자는 이를 오픈소스로 공개하여 트레이더들이 기능을 검토하고 검증할 수 있도록 했습니다. 작성자에게 찬사를 보냅니다! 이 코드는 무료로 사용할 수 있지만, 코드를 재게시하는 경우 하우스 룰이 적용된다는 점을 기억하세요.
면책사항
해당 정보와 게시물은 금융, 투자, 트레이딩 또는 기타 유형의 조언이나 권장 사항으로 간주되지 않으며, 트레이딩뷰에서 제공하거나 보증하는 것이 아닙니다. 자세한 내용은 이용 약관을 참조하세요.