OPEN-SOURCE SCRIPT
Thirdeyechart Global Gold – Last Version
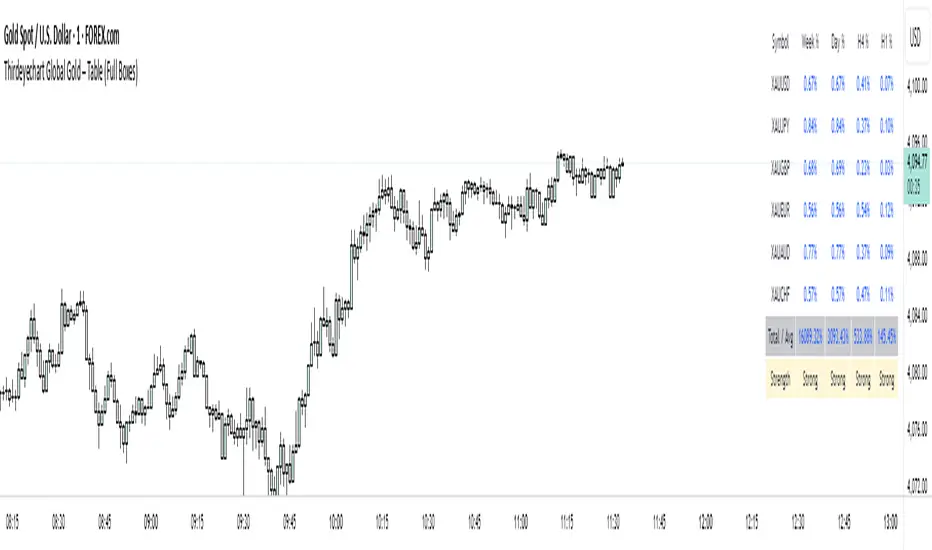
The XAU Solid Trend Table – Last Version is the ultimate TradingView indicator for gold traders who want a clean, professional, and comprehensive view of market direction. This version builds on previous releases by combining percentage changes, multiple timeframes, and a Total Average Calculation into a solid, boxed table that clearly displays strong and weak trends in XAU and its related pairs.
Users can monitor gold across Daily (D), 1-Hour (H1), 4-Hour (H4), and Weekly (W) timeframes. Positive movements are highlighted in blue, negative movements in red, and the Total Average calculation summarizes the overall trend strength, making it easy to spot whether XAU is in a strong uptrend, downtrend, or consolidating.
The table’s solid, boxed layout ensures all information is organized and visually clear, reducing clutter on the chart. This design helps traders quickly interpret market direction, plan trades, and compare multiple pairs like XAU/USD, XAU/JPY, and USD/JPY without confusion.
Coded personally using custom formulas, this indicator emphasizes precision, functionality, and readability. It’s ideal for intraday traders, swing traders, and long-term gold analysts who want a single tool to assess gold’s global movement efficiently.
This script is purely informational and educational. It does not provide buy or sell signals and does not guarantee profits. Traders must perform their own analysis and apply proper risk management before making any trading decisions.
Disclaimer / Copyright:
© 2025 Thirdeyechart. All rights reserved. Redistribution, copying, or commercial use of this code without permission is strictly prohibited. The author is not responsible for any trading losses or financial decisions made based on this script.
오픈 소스 스크립트
트레이딩뷰의 진정한 정신에 따라, 이 스크립트의 작성자는 이를 오픈소스로 공개하여 트레이더들이 기능을 검토하고 검증할 수 있도록 했습니다. 작성자에게 찬사를 보냅니다! 이 코드는 무료로 사용할 수 있지만, 코드를 재게시하는 경우 하우스 룰이 적용된다는 점을 기억하세요.
면책사항
해당 정보와 게시물은 금융, 투자, 트레이딩 또는 기타 유형의 조언이나 권장 사항으로 간주되지 않으며, 트레이딩뷰에서 제공하거나 보증하는 것이 아닙니다. 자세한 내용은 이용 약관을 참조하세요.
오픈 소스 스크립트
트레이딩뷰의 진정한 정신에 따라, 이 스크립트의 작성자는 이를 오픈소스로 공개하여 트레이더들이 기능을 검토하고 검증할 수 있도록 했습니다. 작성자에게 찬사를 보냅니다! 이 코드는 무료로 사용할 수 있지만, 코드를 재게시하는 경우 하우스 룰이 적용된다는 점을 기억하세요.
면책사항
해당 정보와 게시물은 금융, 투자, 트레이딩 또는 기타 유형의 조언이나 권장 사항으로 간주되지 않으며, 트레이딩뷰에서 제공하거나 보증하는 것이 아닙니다. 자세한 내용은 이용 약관을 참조하세요.