OPEN-SOURCE SCRIPT
Double RSI 00 1.0
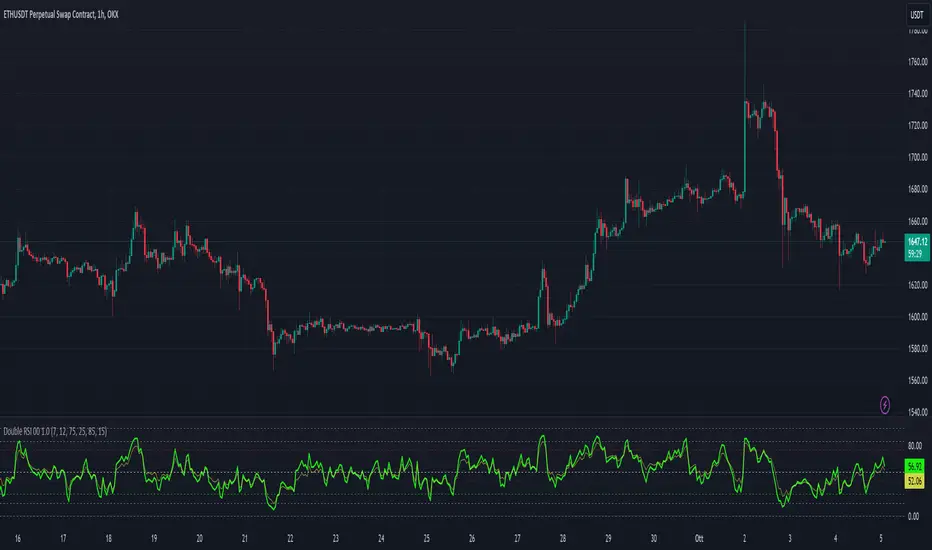
This script creates a custom indicator, visualizes two RSI values (RSI1 and RSI2) on the chart and generates alerts based on different RSI-related conditions, which can be used for technical analysis and trading strategies. Users can customize the RSI parameters and alert levels according to their preferences.
It includes several input parameters that allow the user to customize the RSI calculations and overbought/oversold levels. These parameters include:
length_1: RSI1 Length (default: 7)
length_2: RSI2 Length (default: 12)
overbought_1: Overbought Signal level for RSI1 (default: 75)
oversold_1: Oversold Signal level for RSI1 (default: 25)
overbought_2: High Overbought Signal level for RSI1 (default: 85)
oversold_2: High Oversold Signal level for RSI1 (default: 15)
The script calculates two RSI values: rsi_1 and rsi_2, based on the high and low prices averaged (hl2) and the specified RSI lengths.
It plots these RSI values on the chart using different colors and line widths.
Several horizontal lines are drawn on the chart to represent key levels:
h0: 0 (Lower Band)
h1: 50 (Middle Band)
h2: 100 (Upper Band)
h3: The Oversold level (customizable)
h4: The Overbought level (customizable)
h5: The High Oversold level (customizable)
h6: The High Overbought level (customizable)
The script defines alert conditions for various signals, including overbought, oversold, high overbought, high oversold, long (crossover between RSI1 and RSI2), and short (crossunder between RSI1 and RSI2).
It sends alerts when these conditions are met, indicating potential trading signals.
Please note that this script is meant for educational purposes and should be used cautiously in a real trading environment. It's important to have a thorough understanding of technical analysis and risk management when using such indicators in actual trading.
오픈 소스 스크립트
트레이딩뷰의 진정한 정신에 따라, 이 스크립트의 작성자는 이를 오픈소스로 공개하여 트레이더들이 기능을 검토하고 검증할 수 있도록 했습니다. 작성자에게 찬사를 보냅니다! 이 코드는 무료로 사용할 수 있지만, 코드를 재게시하는 경우 하우스 룰이 적용된다는 점을 기억하세요.
면책사항
해당 정보와 게시물은 금융, 투자, 트레이딩 또는 기타 유형의 조언이나 권장 사항으로 간주되지 않으며, 트레이딩뷰에서 제공하거나 보증하는 것이 아닙니다. 자세한 내용은 이용 약관을 참조하세요.
오픈 소스 스크립트
트레이딩뷰의 진정한 정신에 따라, 이 스크립트의 작성자는 이를 오픈소스로 공개하여 트레이더들이 기능을 검토하고 검증할 수 있도록 했습니다. 작성자에게 찬사를 보냅니다! 이 코드는 무료로 사용할 수 있지만, 코드를 재게시하는 경우 하우스 룰이 적용된다는 점을 기억하세요.
면책사항
해당 정보와 게시물은 금융, 투자, 트레이딩 또는 기타 유형의 조언이나 권장 사항으로 간주되지 않으며, 트레이딩뷰에서 제공하거나 보증하는 것이 아닙니다. 자세한 내용은 이용 약관을 참조하세요.