OPEN-SOURCE SCRIPT
Volatility Heat-Map, momentum ribbon and divergence detector
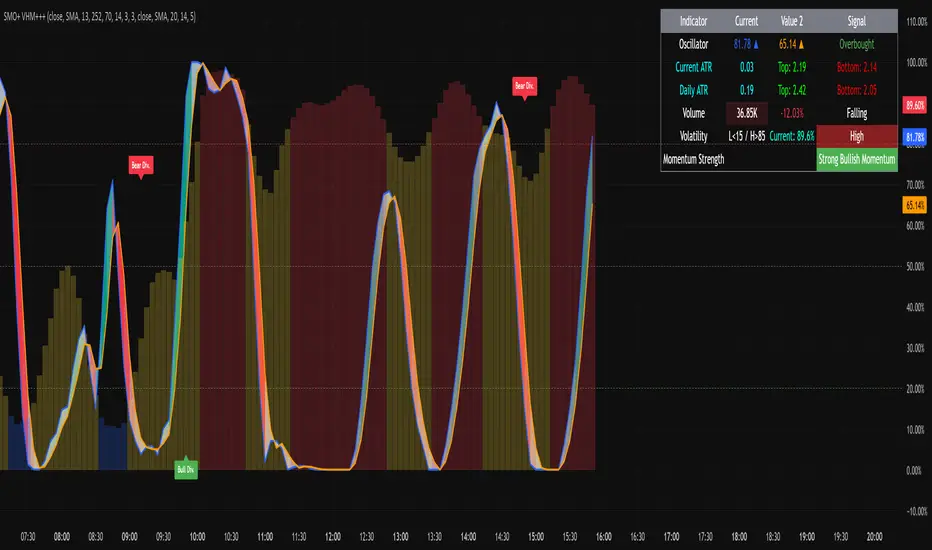
This is a comprehensive volatility + momentum + volume + ATR dashboard with table visualization, momentum ribbon, and divergence detection. It’s optimized for visual clarity with dynamic coloring and is suitable for both trend-following and mean-reversion traders.
Table shows:
Oscillator values with arrows and K/D status.
Current & Daily ATR with tops/bottoms.
Volume & % change, rising/falling indicator.
Volatility regime (Low/Normal/High) with color coding.
Momentum strength (strong/weak bullish/bearish).
Oscillator
stoch = hh != ll ? 100 * (src - ll) / (hh - ll) : 0
k = smooth(stoch, kSmoothing)
d = smooth(k, dSmoothing)
Standard stochastic normalization.
Smoothing based on selected type (SMA/EMA/WMA).
diff between K and D is normalized for the momentum ribbon color:
Greenish for bullish, red for bearish, silver for neutral.
Overbought / Oversold lines: 80/20, midline at 50.
4. BBWP Calculation
bbwp = f_bbwp(i_priceSrc, i_bbwpLen, i_bbwpLkbk, i_basisType)
bbwpSMA5 = f_maType(bbwp, 5, "SMA")
Heatmap Thresholds:
Low < 15%
High > 85%
Otherwise Normal.
Colors dynamically assigned for histogram and table background.
Plotted as columns if table
Bullish and Bearish divergence labels plotted, both regular and hidden.
오픈 소스 스크립트
진정한 트레이딩뷰 정신에 따라 이 스크립트 작성자는 트레이더가 기능을 검토하고 검증할 수 있도록 오픈소스로 공개했습니다. 작성자에게 찬사를 보냅니다! 무료로 사용할 수 있지만 코드를 다시 게시할 경우 하우스 룰이 적용된다는 점을 기억하세요.
Want to join a safe community full of like-minded individuals that work together, not against each other? Join Xtrader! Link for more amazing indicators and support.
discord.gg/NHjztdYv6U
discord.gg/NHjztdYv6U
면책사항
이 정보와 게시물은 TradingView에서 제공하거나 보증하는 금융, 투자, 거래 또는 기타 유형의 조언이나 권고 사항을 의미하거나 구성하지 않습니다. 자세한 내용은 이용 약관을 참고하세요.