OPEN-SOURCE SCRIPT
RSI to Price Ratio
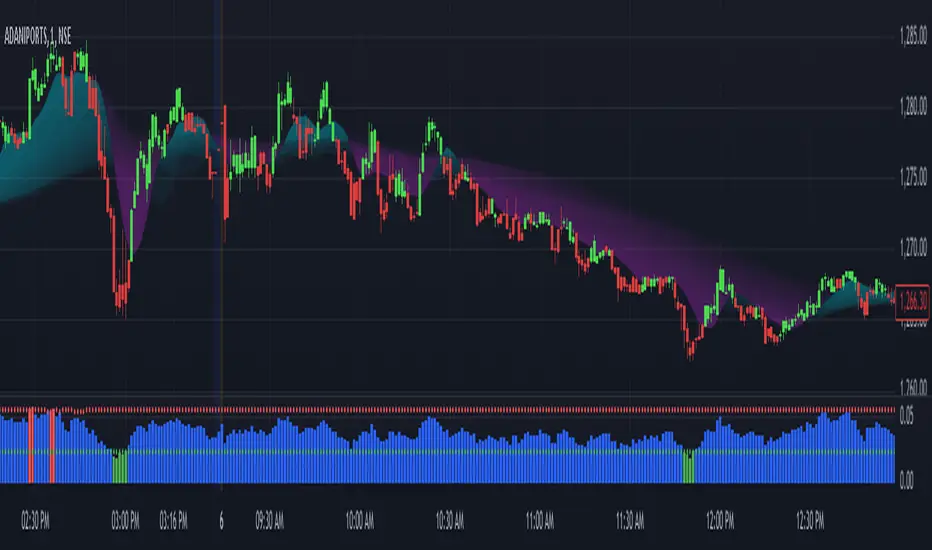
The RSI to Price Ratio is a technical indicator designed to provide traders with a unique perspective by analyzing the relationship between the Relative Strength Index (RSI) and the underlying asset's price. Unlike traditional RSI, which is viewed on a scale from 0 to 100, this indicator normalizes the RSI by dividing it by the price, resulting in a dynamic ratio that adjusts to price movements. The histogram format makes it easy to visualize fluctuations, with distinct color coding for overbought (red), oversold (green), and neutral (blue) conditions.
This indicator excels in helping traders identify potential reversal zones and trend continuation signals. Overbought and oversold levels are dynamically adjusted using the price source, making the indicator more adaptive to market conditions. Additionally, the ability to plot these OB/OS thresholds as lines on the histogram ensures traders can quickly assess whether the market is overstretched in either direction. By combining RSI’s momentum analysis with price normalization, this tool is particularly suited for traders who value precision and nuanced insights into market behavior. It can be used as a standalone indicator or in conjunction with other tools to refine entry and exit strategies.
This indicator excels in helping traders identify potential reversal zones and trend continuation signals. Overbought and oversold levels are dynamically adjusted using the price source, making the indicator more adaptive to market conditions. Additionally, the ability to plot these OB/OS thresholds as lines on the histogram ensures traders can quickly assess whether the market is overstretched in either direction. By combining RSI’s momentum analysis with price normalization, this tool is particularly suited for traders who value precision and nuanced insights into market behavior. It can be used as a standalone indicator or in conjunction with other tools to refine entry and exit strategies.
오픈 소스 스크립트
트레이딩뷰의 진정한 정신에 따라, 이 스크립트의 작성자는 이를 오픈소스로 공개하여 트레이더들이 기능을 검토하고 검증할 수 있도록 했습니다. 작성자에게 찬사를 보냅니다! 이 코드는 무료로 사용할 수 있지만, 코드를 재게시하는 경우 하우스 룰이 적용된다는 점을 기억하세요.
면책사항
해당 정보와 게시물은 금융, 투자, 트레이딩 또는 기타 유형의 조언이나 권장 사항으로 간주되지 않으며, 트레이딩뷰에서 제공하거나 보증하는 것이 아닙니다. 자세한 내용은 이용 약관을 참조하세요.
오픈 소스 스크립트
트레이딩뷰의 진정한 정신에 따라, 이 스크립트의 작성자는 이를 오픈소스로 공개하여 트레이더들이 기능을 검토하고 검증할 수 있도록 했습니다. 작성자에게 찬사를 보냅니다! 이 코드는 무료로 사용할 수 있지만, 코드를 재게시하는 경우 하우스 룰이 적용된다는 점을 기억하세요.
면책사항
해당 정보와 게시물은 금융, 투자, 트레이딩 또는 기타 유형의 조언이나 권장 사항으로 간주되지 않으며, 트레이딩뷰에서 제공하거나 보증하는 것이 아닙니다. 자세한 내용은 이용 약관을 참조하세요.