OPEN-SOURCE SCRIPT
Next Candle Predictor
Next Candle Predictor for TradingView
This Pine Script indicator helps predict potential price movements for the next candle based on historical price action patterns. It analyzes recent candles' characteristics including body size, wick length, and volume to calculate a directional bias.
Key Features
Analyzes recent price action to predict next candle direction (Bullish, Bearish, or Neutral)
Visual indicators include small directional arrows and a prediction line
Customizable sensitivity and lookback period
Works best on lower timeframes for short-term price action trading
Displays clear prediction labels that extend into future bars
How It Works
The script analyzes recent candles by examining:
Candle body size (weighted by your preference)
Wick length (weighted by your preference)
Volume activity (weighted by your preference)
These factors combine to create a directional strength indicator that determines if the next candle is likely to be bullish, bearish, or neutral.
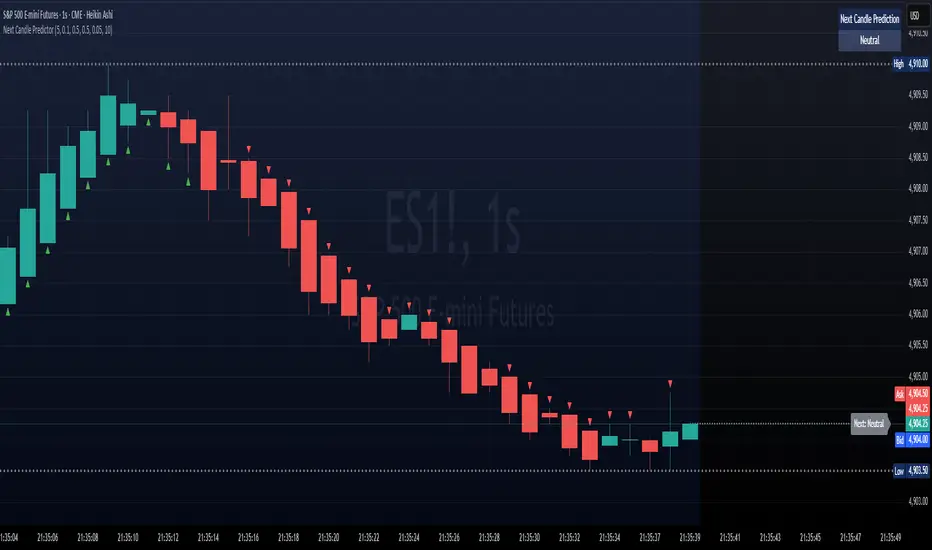
Visual Feedback
Green up arrows indicate bullish predictions
Red down arrows indicate bearish predictions
A directional line extends from the last candle showing predicted price movement
A label displays the prediction text at the end of the line
Information table in the top right displays the current prediction
Settings
Lookback Candle Count: Number of historical candles to analyze (2-20)
Wick/Body/Volume Weight Factors: Adjust importance of each component
Prediction Sensitivity: Threshold for triggering directional bias
Prediction Line Length: How far the prediction line extends
Perfect for day traders and scalpers looking for an edge in short-term directional bias.
This Pine Script indicator helps predict potential price movements for the next candle based on historical price action patterns. It analyzes recent candles' characteristics including body size, wick length, and volume to calculate a directional bias.
Key Features
Analyzes recent price action to predict next candle direction (Bullish, Bearish, or Neutral)
Visual indicators include small directional arrows and a prediction line
Customizable sensitivity and lookback period
Works best on lower timeframes for short-term price action trading
Displays clear prediction labels that extend into future bars
How It Works
The script analyzes recent candles by examining:
Candle body size (weighted by your preference)
Wick length (weighted by your preference)
Volume activity (weighted by your preference)
These factors combine to create a directional strength indicator that determines if the next candle is likely to be bullish, bearish, or neutral.
Visual Feedback
Green up arrows indicate bullish predictions
Red down arrows indicate bearish predictions
A directional line extends from the last candle showing predicted price movement
A label displays the prediction text at the end of the line
Information table in the top right displays the current prediction
Settings
Lookback Candle Count: Number of historical candles to analyze (2-20)
Wick/Body/Volume Weight Factors: Adjust importance of each component
Prediction Sensitivity: Threshold for triggering directional bias
Prediction Line Length: How far the prediction line extends
Perfect for day traders and scalpers looking for an edge in short-term directional bias.
오픈 소스 스크립트
트레이딩뷰의 진정한 정신에 따라, 이 스크립트의 작성자는 이를 오픈소스로 공개하여 트레이더들이 기능을 검토하고 검증할 수 있도록 했습니다. 작성자에게 찬사를 보냅니다! 이 코드는 무료로 사용할 수 있지만, 코드를 재게시하는 경우 하우스 룰이 적용된다는 점을 기억하세요.
면책사항
해당 정보와 게시물은 금융, 투자, 트레이딩 또는 기타 유형의 조언이나 권장 사항으로 간주되지 않으며, 트레이딩뷰에서 제공하거나 보증하는 것이 아닙니다. 자세한 내용은 이용 약관을 참조하세요.
오픈 소스 스크립트
트레이딩뷰의 진정한 정신에 따라, 이 스크립트의 작성자는 이를 오픈소스로 공개하여 트레이더들이 기능을 검토하고 검증할 수 있도록 했습니다. 작성자에게 찬사를 보냅니다! 이 코드는 무료로 사용할 수 있지만, 코드를 재게시하는 경우 하우스 룰이 적용된다는 점을 기억하세요.
면책사항
해당 정보와 게시물은 금융, 투자, 트레이딩 또는 기타 유형의 조언이나 권장 사항으로 간주되지 않으며, 트레이딩뷰에서 제공하거나 보증하는 것이 아닙니다. 자세한 내용은 이용 약관을 참조하세요.